Wednesday Touring
The first home is Kelly and Lisa’s listing and they are great agents. They did better than us last year with fewer people! Their listing is priced at $3,800,000. Kurtney’s listing on Neptune is priced at $10,000,000.

The first home is Kelly and Lisa’s listing and they are great agents. They did better than us last year with fewer people! Their listing is priced at $3,800,000. Kurtney’s listing on Neptune is priced at $10,000,000.
This is from the late-70s and features lead-guitarist Jimmy McCulloch playing bass guitar – though I think he’s only playing one or two notes. I say late 70s because he died in 1979 at age 26 from heart failure caused by morphine and alcohol poisining. They look a little hyped-up here, don’t they?
It was in October last year that I was lining up new listings for January, 2025. Today, I’m already pushing sellers to next year – and specifically to hit the market in January, 2026, rather than now. I’m not the only one:
NSDCC Cancelled, Expired, & Withdrawn Listings in July
2023: 67
2024: 93
2025: 138
It will become a very popular choice for unsuccessful sellers to cancel their listing now, and “wait until the market gets better” – rather than adjust their price. It might keep the door open for the remaining sellers to get lucky over the next month or two, but generally the focus for most sellers and agents will be on next spring.
If you thought there was a surge of listings in 2025, wait until next year!
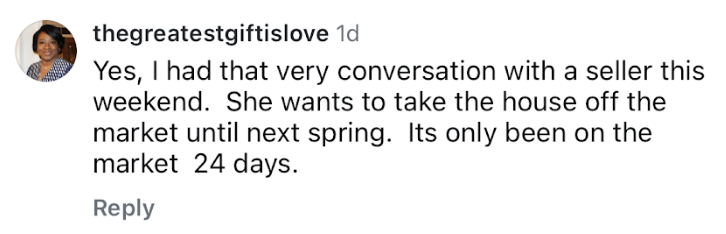
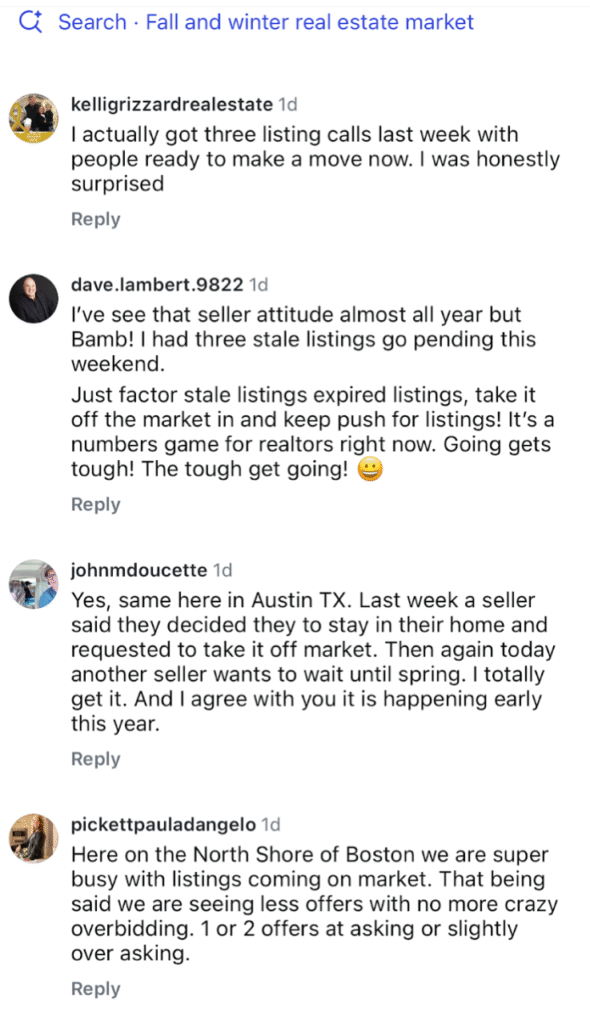
Glennda is an active agent in Atlanta, and she posed the question yesterday on her Insta account. Do you have sellers who want to cancel their listing now and wait until next year? Here are responses from around the country:
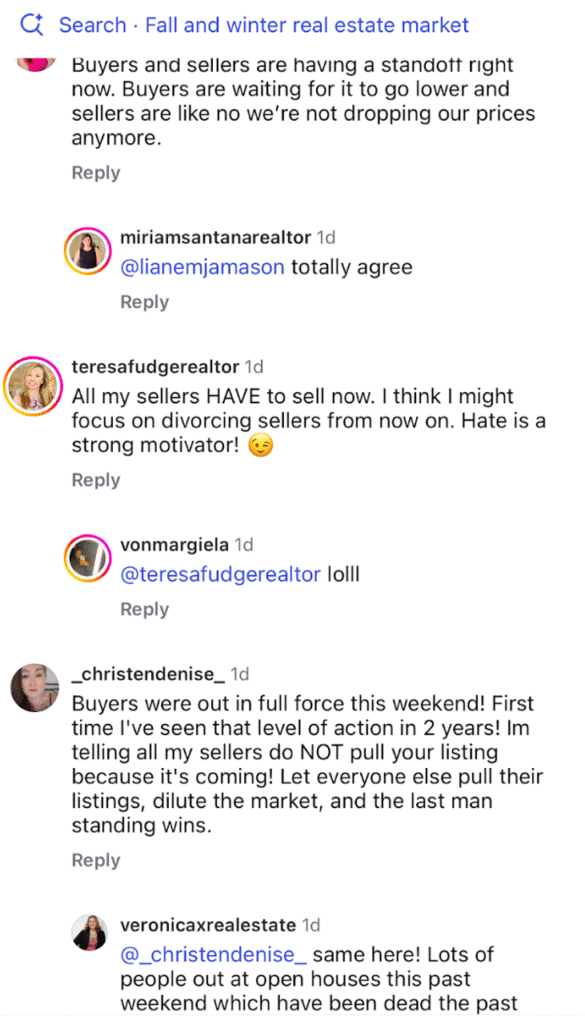
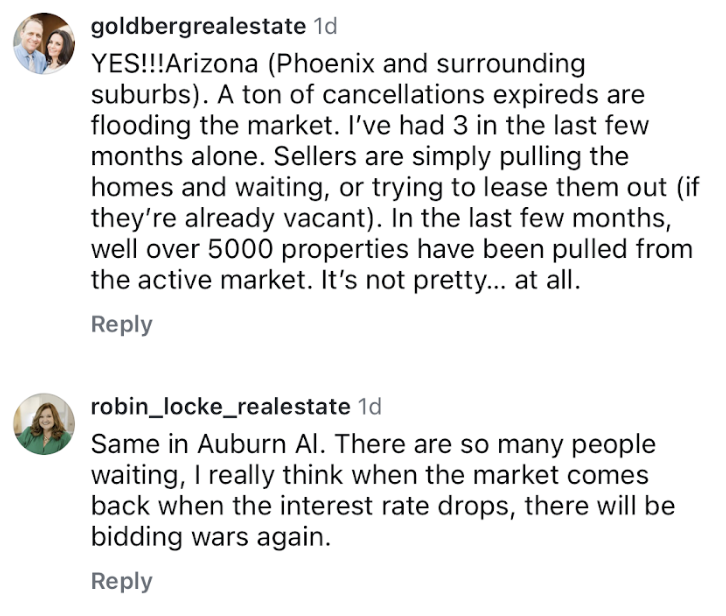
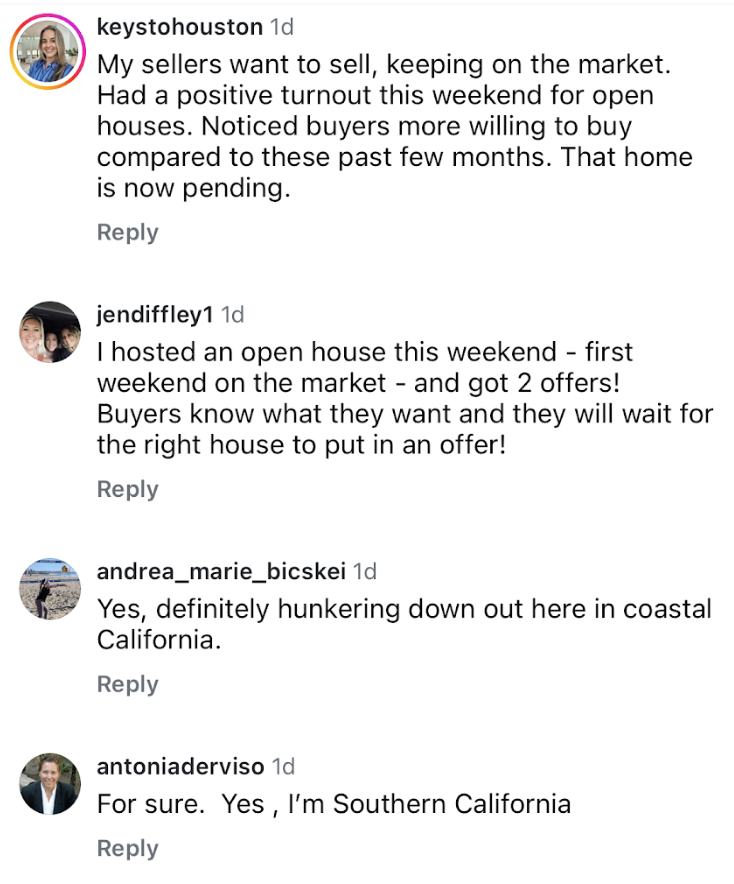
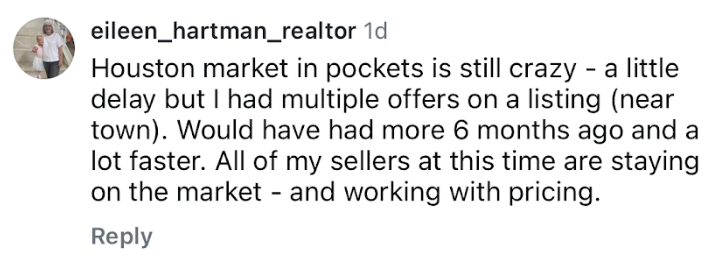
If you’re already on the market, you might as well stick it out and hope the current inventory thins out quickly – you can always cancel in the 4th quarter and try again next year. But if you’re not on the market and want to wait until the spring selling season, don’t be surprised if A LOT of other sellers are thinking the same thing!

Whether you’re living in an apartment or condo, downsizing to a smaller home, or just trying to make the most of a smaller floor plan, then utilizing smart storage and layout tricks can completely change how your home feels. With a little creativity, even the smallest spaces can feel open, organized, and welcoming.
Here are some space-saving tips! These ideas all work whether you own or rent – most can be done without major renovations.
1. Go Vertical – When floor space is limited, walls become prime real estate. Install floating shelves, pegboards, or wall-mounted hooks to store items and display décor. Even over-the-door racks can add instant storage for shoes, coats, or accessories.
2. Utilize Hidden Storage – Look for pieces with hidden storage – ottomans, benches, couches, and coffee tables with lift-up lids or drawers. Beds with built-in drawers or lift-up frames can replace bulky dressers.
3. Create “Zones” Without Walls – By using rugs, lighting, or open shelving to break up the space visually, define different areas to make a single room feel larger and create more opportunities for various activities. Folding or sliding screens are great for creating a temporary work-from-home nook.
4. Opt for Foldable or Stackable – Drop-leaf tables, nesting tables, and fold-down desks make it easy to switch between “living” and “working” mode. Stackable stools or chairs are perfect for guests but don’t take up space when not in use.
5. Use Mirrors to Open Up a Room – Strategically placed mirrors, especially full length ones, reflect light and create the illusion of depth, making a room feel bigger.
6. Hide Storage in Plain Sight – Baskets, trunks, and decorative boxes double as storage and style. A slim rolling cart can fit into narrow gaps and fashionable baskets can add some flare to a room while organizing blankets and pillows.
7. Maximize Kitchen Space – Mount magnetic strips for knives, use under-cabinet hooks for mugs, and add stacking shelves inside cabinets to double your storage. See here for more kitchen specific organizing tips.
Natalie the Dancing Realtor!
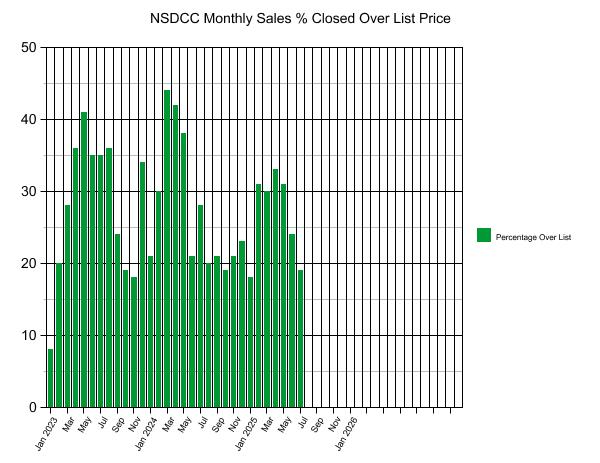
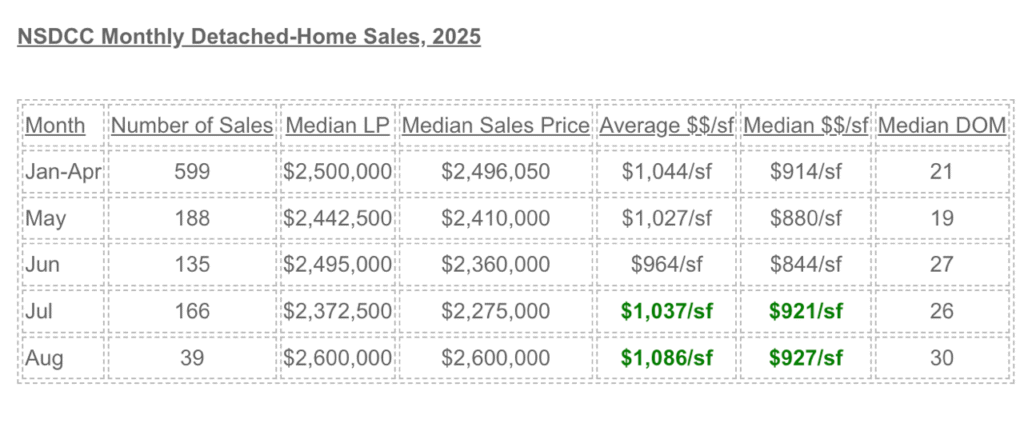
Looking for a sign that the market is still alive and well? There were 31 of the 166 sales last month (19%) that closed over their list price! The average amount paid over the list price was $66,000, or about +2% on average.
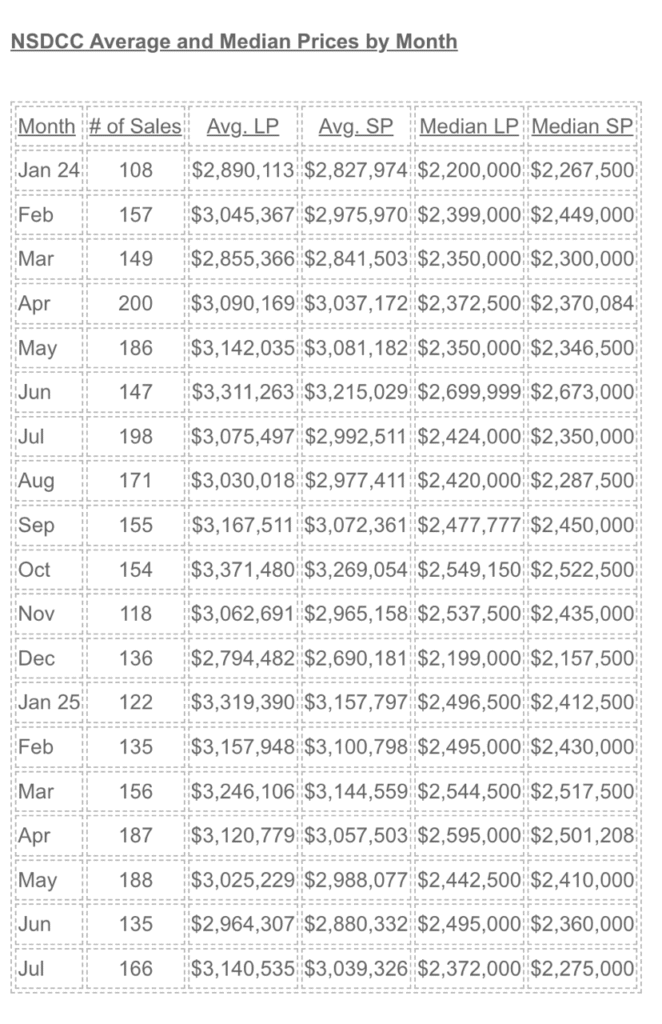
The median price is about the worst way to gauge pricing because the houses that sell each month are so different. Maybe the trend is noteworthy? No real concerns here – the average sales price is up 6% and the median is down 4% MoM:

During the covid frenzy, buyers were forced to live with everything. Bidding wars with no rules of engagement, paying way over list price, having to buy the home as-is and tolerate 1-2 months of free rent – plus the buyers were generally treated like they should feel lucky to get the house. And they put up with it!
Boy, is it different now.
Today, buyers are looking for any reason to stay on the fence.
I think it’s why the market can slow for weeks or months at a time, then all of a sudden a bunch of homes go pending. Buyers hold out as long as they can, but at some point they realize there are no perfect homes and they have to live with something.
Here’s my challenge to buyers and buyer-agents everywhere.
Live with just one thing.
It’s all too common for today’s buyers to search every home for something wrong, and then throw their hands up and declare, “Ok, I found something I don’t like – on to the next home.”
Recognize that there are no perfect homes and you have to live with something.
If you are looking hard and can only find one thing, it’s probably the house for you!
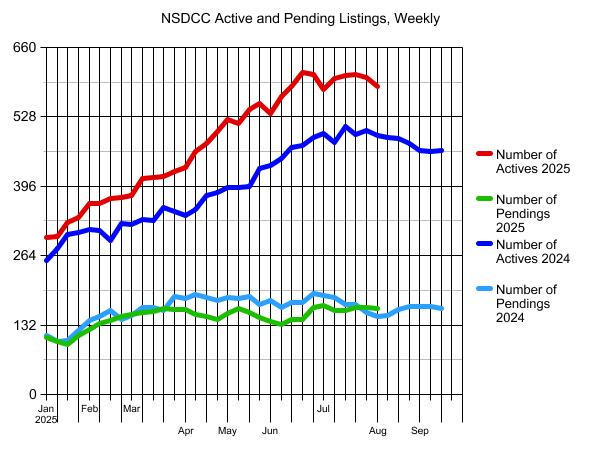
The number of pendings has been very consistent since the end of June.
In the previous five weeks (May 26-June 23), the number of pendings were in the 134-146 range.
Since June 30th, they have ramped up and have been steadily in the 159-169 range every week. For the count to stay so consistent, it means new escrows are opening as fast as sales are closing.
Is it because prices are finally starting to fall?
Are sellers dumping on price to get out?
Pricing was getting softer coming out of spring, but it’s firmed up nicely:
There are 4-6 weeks left of the late-summer rally!
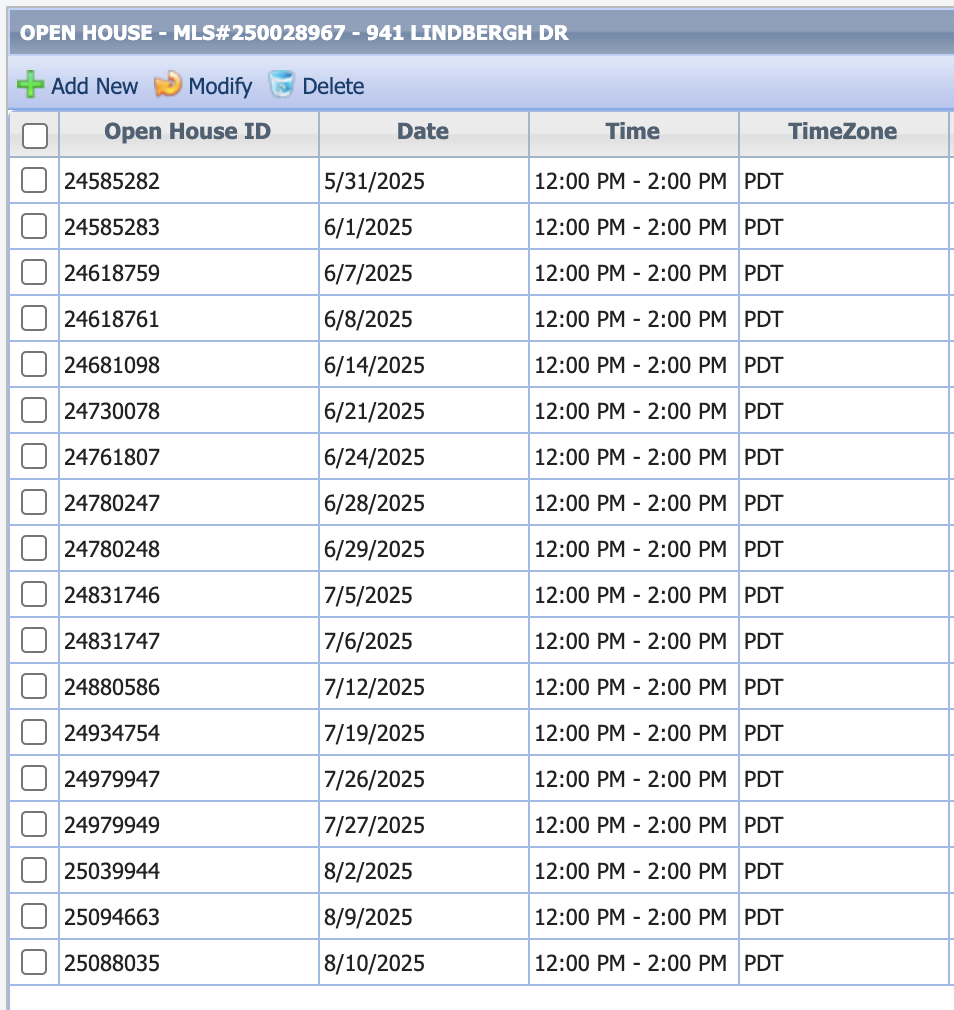
When we went on the market, there were ten active listings and no pendings, which looked daunting. A new-home tract nearby was trying to sell off their last few stragglers plus there were three others in our tract that had just hit their two-year mark and became eligible for their tax-free winnings.
There are times when price adjustments are necessary, and other times when patience is needed until a few sales happen to help create a more-active marketplace. It probably wasn’t going to hurt to have KB Home conduct the price discovery because they can hide it in their incentive packages and not have to drop their prices much.
Here’s how it’s evolved over the last 2.5 months!

More ideas on where to move!
https://www.cntraveler.com/gallery/the-most-beautiful-towns-in-america
In this week’s Compass Intelligence Weekly, Chief Economist Mike Simonsen breaks down the latest housing market data and uncovers a surprising trend: fewer and fewer homeowners are choosing to sell.
While home prices remain just slightly above 2024 levels, inventory is climbing—and yet, the number of new listings is flattening out. Mike calls this trend The Great Stay: Americans are staying in their homes, jobs, and towns longer, driven by high mortgage rates and a sluggish job market.
This week’s episode covers:
– New listings trend: why seller momentum has stalled
– Inventory growth and what it means for buyers
– Pending home sales and early signals for Q3
– Home prices holding—but barely
– Price reductions and what they reveal about buyer behavior
Get ahead of the headlines with real-time data from Altos Research and insights from Compass—the #1 real estate brokerage in the U.S. by sales volume.


