

The market is heating up fast and early this year! The majority of home buyers paid over the list price in February, and these were decisions mostly made in January:
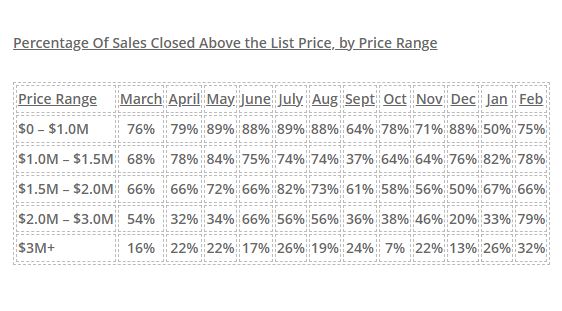
NSDCC Detached-Home Sales, % Closed Over List Price
January: 38%
February: 43%
March: 53%
April: 55%
May: 54%
June: 59%
July: 64%
August: 55%
September: 41%
October: 45%
November: 48%
December: 48%
January: 49%
February: 60%
~~~~~~~~~~~~~~~~~~~~~~~~~~~~~~~~~~~~~~~~~~~~~~~
~~~~~~~~~~~~~~~~~~~~~~~~~~~~~~~~~~~~~~~~~~~~~~~
Even though the 2022 listings count for the first two months of the year is 33% BELOW the count in 2021, sales are only 16% under the average for the last five years:
NSDCC January + February Sales
2017: 174 + 172 = 346
2018: 149 + 162 = 311
2019: 150 + 174 = 324
2020: 182 + 184 = 366
2021: 187 + 224 = 411
2022: 140 + 156 = 296
~~~~~~~~~~~~~~~~~~~~~~~~~~~~~~~~~~~~~~~~~~~~~~~
NSDCC Average and Median Prices
| Month | |||||
| Feb | |||||
| March | |||||
| April | |||||
| May | |||||
| June | |||||
| July | |||||
| Aug | |||||
| Sept | |||||
| Oct | |||||
| Nov | |||||
| Dec | |||||
| Jan | |||||
| Feb |
The average sales price went up 7% MoM in January, and 9% in February.
The median sales price went up 4% MoM in January, and 7% in February.
THE MEDIAN SALES PRICE WENT UP 7% IN ONE MONTH!
This is the craziest real estate market ever – and the spring selling season is just getting started!
~~~~~~~~~~~~~~~~~~~~~~~~~~~~~~~~~~~~~~


There must be a glitch in the MLS stats too.
They show that the median days-on-market was 9, but there were actually 63% of the sales that went pending in nine days or less. The median was seven days.
There were 17 sales with zero days on market.
There was another sale that closed for $1,000,000 over its list price – a cash buy with a 14-day escrow:
https://www.compass.com/listing/1380-park-row-la-jolla-ca-92037/960292137401865561/
They put it back on the market for $5,250,000!