Historically, when home prices went up, more people would list their house for sale to cash in.
But now it’s the opposite:
NSDCC Number of Detached-Home Listings Jan 1 to Oct 31
| Year |
# of Listings |
% YoY diff |
Median LP |
% YoY diff |
| 2018 |
4,404 |
– |
$1,499,000 |
– |
| 2019 |
4,341 |
-1% |
$1,579,000 |
+5% |
| 2020 |
4,134 |
-5% |
$1,695,000 |
+7% |
| 2021 |
3,498 |
-15% |
$1,927,000 |
+14% |
| 2022 |
2,768 |
-21% |
$2,350,000 |
+22% |
| 2023 |
2,312 |
-16% |
$2,489,000 |
+6% |
If pricing flattens out here, it would really cause a tizzy because sellers keep adding extra mustard to their list price. They would be disappointed next year – and create a potential for unsold listings to stack up earlier.
But this year’s total number of listings is still 48% below those in 2018, so if there were 10% more listings lying around, would anyone notice? Probably not.
The $0 – $1,500,000 Market:
| Date |
NSDCC Active Listings |
Avg. LP/sf |
Avg. DOM |
# of Pendings |
| Jan 2, 2023 |
22 |
$719/sf |
75 |
15 |
| Jan 9 |
26 |
$687/sf |
50 |
14 |
| Jan 16 |
23 |
$701/sf |
52 |
20 |
| Jan 23 |
25 |
$751/sf |
60 |
21 |
| Jan 30 |
23 |
$788/sf |
45 |
25 |
| Feb 6 |
18 |
$750/sf |
59 |
24 |
| Feb 13 |
18 |
$770/sf |
48 |
26 |
| Feb 20 |
17 |
$778/sf |
49 |
26 |
| Feb 27 |
18 |
$802/sf |
48 |
23 |
| Mar 6 |
22 |
$802/sf |
44 |
14 |
| Mar 13 |
22 |
$747/sf |
45 |
16 |
| Mar 20 |
16 |
$826/sf |
49 |
21 |
| Mar 27 |
17 |
$853/sf |
47 |
20 |
| Apr 3 |
19 |
$803/sf |
37 |
20 |
| Apr 10 |
11 |
$778/sf |
53 |
30 |
| Apr 17 |
15 |
$690/sf |
44 |
27 |
| Apr 24 |
12 |
$682/sf |
33 |
25 |
| May 1 |
11 |
$795/sf |
35 |
27 |
| May 8 |
14 |
$780/sf |
33 |
24 |
| May 15 |
16 |
$770/sf |
37 |
22 |
| May 22 |
21 |
$747/sf |
45 |
18 |
| May 29 |
20 |
$757/sf |
52 |
21 |
| Jun 5 |
23 |
$755/sf |
49 |
20 |
| Jun 12 |
17 |
$711/sf |
31 |
32 |
| Jun 19 |
16 |
$674/sf |
34 |
33 |
| Jun 26 |
20 |
$677/sf |
32 |
29 |
| Jul 3 |
21 |
$645/sf |
28 |
33 |
| Jul 10 |
23 |
$692/sf |
30 |
32 |
| Jul 17 |
21 |
$730/sf |
37 |
30 |
| Jul 24 |
21 |
$704/sf |
37 |
32 |
| Jul 31 |
21 |
$713/sf |
44 |
27 |
| Aug 7 |
22 |
$692/sf |
50 |
25 |
| Aug 14 |
24 |
$693/sf |
48 |
24 |
| Aug 21 |
22 |
$688/sf |
25 |
29 |
| Aug 28 |
25 |
$679/sf |
47 |
38 |
| Sep 4 |
23 |
$718/sf |
50 |
36 |
| Sep 11 |
29 |
$685/sf |
44 |
33 |
| Sep 18 |
28 |
$696/sf |
35 |
28 |
| Sep 25 |
31 |
$725/sf |
36 |
25 |
| Oct 2 |
24 |
$711/sf |
50 |
25 |
| Oct 9 |
29 |
$742/sf |
47 |
20 |
| Oct 16 |
35 |
$762/sf |
45 |
14 |
| Oct 23 |
31 |
$745/sf |
43 |
18 |
| Oct 30 |
28 |
$777/sf |
40 |
16 |
| Nov 6 |
28 |
$791/sf |
41 |
16 |
| Nov 13 |
26 |
$794/sf |
46 |
16 |
| Nov 20 |
31 |
$849/sf |
49 |
10 |
The $1,500,000 – $2,000,000 Market:
| Date |
NSDCC Active Listings |
Avg. LP/sf |
Avg. DOM |
# of Pendings |
| Jan 2, 2023 |
45 |
$809/sf |
60 |
18 |
| Jan 9 |
55 |
$828/sf |
53 |
19 |
| Jan 16 |
46 |
$838/sf |
53 |
30 |
| Jan 23 |
43 |
$793/sf |
52 |
31 |
| Jan 30 |
40 |
$778/sf |
54 |
34 |
| Feb 6 |
42 |
$814/sf |
46 |
30 |
| Feb 13 |
35 |
$823/sf |
51 |
39 |
| Feb 20 |
34 |
$801/sf |
47 |
40 |
| Feb 27 |
27 |
$846/sf |
33 |
45 |
| Mar 6 |
29 |
$893/sf |
33 |
41 |
| Mar 13 |
32 |
$850/sf |
33 |
39 |
| Mar 20 |
27 |
$872/sf |
36 |
41 |
| Mar 27 |
22 |
$832/sf |
39 |
36 |
| Apr 3 |
21 |
$779/sf |
27 |
36 |
| Apr 10 |
22 |
$816/sf |
26 |
33 |
| Apr 17 |
27 |
$797/sf |
21 |
33 |
| Apr 24 |
28 |
$856/sf |
31 |
34 |
| Apr 24 |
28 |
$856/sf |
31 |
34 |
| May 1 |
30 |
$789/sf |
28 |
36 |
| May 8 |
36 |
$808/sf |
25 |
37 |
| May 15 |
33 |
$776/sf |
33 |
44 |
| May 22 |
35 |
$818/sf |
36 |
44 |
| May 29 |
38 |
$786/sf |
33 |
40 |
| Jun 5 |
39 |
$791/sf |
34 |
30 |
| Jun 12 |
37 |
$754/sf |
37 |
32 |
| Jun 19 |
36 |
$779/sf |
35 |
35 |
| Jun 26 |
39 |
$766/sf |
34 |
36 |
| Jul 3 |
39 |
$776/sf |
41 |
40 |
| Jul 10 |
45 |
$780/sf |
37 |
39 |
| Jul 17 |
53 |
$807/sf |
29 |
36 |
| Jul 24 |
51 |
$787/sf |
32 |
38 |
| Jul 31 |
51 |
$763/sf |
30 |
39 |
| Aug 7 |
45 |
$750/sf |
36 |
39 |
| Aug 14 |
42 |
$739/sf |
38 |
39 |
| Aug 21 |
39 |
$707/sf |
29 |
46 |
| Aug 28 |
51 |
$723/sf |
30 |
39 |
| Sep 4 |
46 |
$739/sf |
31 |
30 |
| Sep 11 |
42 |
$771/sf |
27 |
30 |
| Sep 18 |
40 |
$805/sf |
27 |
31 |
| Sep 25 |
38 |
$851/sf |
28 |
33 |
| Oct 2 |
45 |
$827/sf |
28 |
27 |
| Oct 9 |
43 |
$891/sf |
32 |
27 |
| Oct 16 |
48 |
$848/sf |
32 |
30 |
| Oct 23 |
48 |
$837/sf |
34 |
26 |
| Oct 30 |
49 |
$829/sf |
34 |
30 |
| Nov 6 |
51 |
$825/sf |
36 |
23 |
| Nov 13 |
52 |
$826/sf |
38 |
24 |
| Nov 20 |
65 |
$863/sf |
35 |
19 |
The $2,000,000 – $3,000,000 Market:
| Date |
NSDCC Active Listings |
Avg. LP/sf |
Avg. DOM |
# of Pendings |
| Jan 2, 2023 |
52 |
$869/sf |
69 |
30 |
| Jan 9 |
57 |
$940/sf |
66 |
31 |
| Jan 16 |
50 |
$948/sf |
61 |
36 |
| Jan 23 |
51 |
$949/sf |
58 |
35 |
| Jan 30 |
54 |
$964/sf |
55 |
34 |
| Feb 6 |
60 |
$930/sf |
51 |
42 |
| Feb 13 |
51 |
$1,038/sf |
52 |
47 |
| Feb 20 |
58 |
$1,022/sf |
47 |
46 |
| Feb 27 |
56 |
$1,064/sf |
52 |
49 |
| Mar 6 |
57 |
$995/sf |
50 |
50 |
| Mar 13 |
55 |
$1,015/sf |
53 |
47 |
| Mar 20 |
50 |
$1,011/sf |
58 |
50 |
| Mar 27 |
54 |
$1,039/sf |
49 |
47 |
| Apr 3 |
54 |
$1,035/sf |
52 |
38 |
| Apr 10 |
55 |
$1,004/sf |
48 |
42 |
| Apr 17 |
64 |
$985/sf |
47 |
46 |
| Apr 24 |
57 |
$1,001/sf |
43 |
50 |
| May 1 |
57 |
$1,008/sf |
42 |
45 |
| May 8 |
68 |
$1,031/sf |
36 |
41 |
| May 15 |
71 |
$1,007/sf |
34 |
39 |
| May 22 |
77 |
$1,003/sf |
34 |
38 |
| May 29 |
74 |
$1,002/sf |
39 |
43 |
| Jun 5 |
77 |
$991/sf |
42 |
44 |
| Jun 12 |
82 |
$986/sf |
48 |
45 |
| Jun 19 |
90 |
$978/sf |
48 |
33 |
| Jun 26 |
90 |
$1,015/sf |
49 |
33 |
| Jul 3 |
92 |
$1,019/sf |
49 |
36 |
| Jul 10 |
89 |
$1,021/sf |
50 |
44 |
| Jul 17 |
97 |
$1,013/sf |
48 |
42 |
| Jul 24 |
91 |
$1,010/sf |
48 |
42 |
| Jul 31 |
81 |
$999/sf |
56 |
52 |
| Aug 7 |
81 |
$1,011/sf |
53 |
49 |
| Aug 14 |
76 |
$996/sf |
58 |
48 |
| Aug 21 |
71 |
$959/sf |
45 |
49 |
| Aug 28 |
82 |
$990/sf |
46 |
43 |
| Sep 4 |
81 |
$1,022/sf |
46 |
39 |
| Sep 11 |
84 |
$1,017/sf |
44 |
39 |
| Sep 18 |
82 |
$1,031/sf |
43 |
44 |
| Sep 25 |
87 |
$1,079/sf |
44 |
41 |
| Oct 2 |
83 |
$1,081/sf |
43 |
44 |
| Oct 9 |
83 |
$1,056/sf |
46 |
42 |
| Oct 16 |
76 |
$1,059/sf |
48 |
42 |
| Oct 23 |
78 |
$1,068/sf |
46 |
47 |
| Oct 30 |
72 |
$1,068/sf |
53 |
38 |
| Nov 6 |
80 |
$1,051/sf |
46 |
33 |
| Nov 13 |
73 |
$1,039/sf |
54 |
26 |
| Nov 20 |
67 |
$1,063/sf |
52 |
35 |
The $3,000,000 – $4,000,000 Market:
| Date |
NSDCC Active Listings |
Avg. LP/sf |
Avg. DOM |
# of Pendings |
| Jan 2, 2023 |
29 |
$1,236/sf |
85 |
6 |
| Jan 9 |
29 |
$1,180/sf |
80 |
5 |
| Jan 16 |
31 |
$1,196/sf |
73 |
8 |
| Jan 23 |
33 |
$1,201/sf |
71 |
7 |
| Jan 30 |
37 |
$1,218/sf |
70 |
6 |
| Feb 6 |
34 |
$1,236/sf |
75 |
12 |
| Feb 13 |
43 |
$1,333/sf |
68 |
11 |
| Feb 20 |
39 |
$1,392/sf |
71 |
18 |
| Feb 27 |
37 |
$1,323/sf |
68 |
22 |
| Mar 6 |
49 |
$1,222/sf |
56 |
20 |
| Mar 13 |
49 |
$1,312/sf |
49 |
22 |
| Mar 20 |
46 |
$1,321/sf |
52 |
25 |
| Mar 27 |
50 |
$1,329/sf |
52 |
25 |
| Apr 3 |
49 |
$1,342/sf |
51 |
23 |
| Apr 10 |
50 |
$1,321/sf |
57 |
24 |
| Apr 17 |
47 |
$1,342/sf |
59 |
26 |
| Apr 24 |
49 |
$1,281/sf |
63 |
28 |
| May 1 |
53 |
$1,227/sf |
62 |
23 |
| May 8 |
55 |
$1,122/sf |
63 |
19 |
| May 15 |
57 |
$1,211/sf |
59 |
19 |
| May 22 |
59 |
$1,170/sf |
61 |
19 |
| May 29 |
60 |
$1,171/sf |
60 |
17 |
| Jun 5 |
70 |
$1,178/sf |
55 |
15 |
| Jun 12 |
64 |
$1,198/sf |
53 |
18 |
| Jun 19 |
67 |
$1,184/sf |
54 |
20 |
| Jun 26 |
66 |
$1,204/sf |
58 |
25 |
| Jul 3 |
63 |
$1,215/sf |
58 |
22 |
| Jul 10 |
72 |
$1,204/sf |
59 |
23 |
| Jul 17 |
79 |
$1,173/sf |
64 |
22 |
| Jul 24 |
78 |
$1,182/sf |
63 |
23 |
| Jul 31 |
69 |
$1,181/sf |
66 |
22 |
| Aug 7 |
72 |
$1,214/sf |
65 |
19 |
| Aug 14 |
65 |
$1,224/sf |
67 |
26 |
| Aug 21 |
66 |
$1,236/sf |
57 |
24 |
| Aug 28 |
64 |
$1,232/sf |
64 |
20 |
| Sep 4 |
59 |
$1,215/sf |
70 |
21 |
| Sep 11 |
50 |
$1,134/sf |
78 |
22 |
| Sep 18 |
46 |
$1,150/sf |
80 |
20 |
| Sep 25 |
47 |
$1,182/sf |
84 |
20 |
| Oct 2 |
45 |
$1,221/sf |
80 |
15 |
| Oct 9 |
47 |
$1,205/sf |
75 |
10 |
| Oct 16 |
49 |
$1,192/sf |
80 |
15 |
| Oct 23 |
49 |
$1,201/sf |
71 |
13 |
| Oct 30 |
47 |
$1,191/sf |
73 |
14 |
| Nov 6 |
46 |
$1,183/sf |
77 |
17 |
| Nov 13 |
44 |
$1,206/sf |
77 |
18 |
| Nov 20 |
48 |
$1,176/sf |
74 |
14 |
The $4,000,000+ Market:
| Date |
NSDCC Active Listings |
Avg. LP/sf |
Avg. DOM |
# of Pendings |
| Jan 2, 2023 |
121 |
$1,744/sf |
126 |
21 |
| Jan 9 |
119 |
$1,716/sf |
123 |
20 |
| Jan 16 |
120 |
$1,761/sf |
121 |
26 |
| Jan 23 |
122 |
$1,707/sf |
119 |
27 |
| Jan 30 |
120 |
$1,680/sf |
121 |
30 |
| Feb 6 |
125 |
$1,714/sf |
118 |
28 |
| Feb 13 |
121 |
$1,750/sf |
116 |
32 |
| Feb 20 |
129 |
$1,725/sf |
112 |
33 |
| Feb 27 |
124 |
$1,743/sf |
115 |
31 |
| Mar 6 |
122 |
$1,753/sf |
109 |
28 |
| Mar 13 |
120 |
$1,782/sf |
109 |
32 |
| Mar 20 |
129 |
$1,783/sf |
106 |
28 |
| Mar 27 |
127 |
$1,781/sf |
106 |
27 |
| Apr 3 |
131 |
$1,774/sf |
105 |
27 |
| Apr 10 |
136 |
$1,788/sf |
107 |
24 |
| Apr 17 |
140 |
$1,776/sf |
108 |
27 |
| Apr 24 |
141 |
$1,771/sf |
107 |
31 |
| May 1 |
142 |
$1,760/sf |
105 |
30 |
| May 8 |
140 |
$1,737/sf |
104 |
32 |
| May 15 |
141 |
$1,812/sf |
107 |
37 |
| May 22 |
145 |
$1,816/sf |
106 |
29 |
| May 29 |
142 |
$1,846/sf |
110 |
36 |
| Jun 5 |
152 |
$1,791/sf |
107 |
31 |
| Jun 12 |
163 |
$1,777/sf |
106 |
24 |
| Jun 19 |
166 |
$1,779/sf |
102 |
26 |
| Jun 26 |
179 |
$1,758/sf |
98 |
29 |
| Jul 3 |
184 |
$1,670/sf |
91 |
39 |
| Jul 10 |
192 |
$1,653/sf |
92 |
42 |
| Jul 17 |
187 |
$1,666/sf |
94 |
47 |
| Jul 24 |
185 |
$1,668/sf |
98 |
49 |
| Jul 31 |
184 |
$1,653/sf |
102 |
51 |
| Aug 7 |
178 |
$1,639/sf |
101 |
51 |
| Aug 14 |
182 |
$1,625/sf |
106 |
45 |
| Aug 21 |
177 |
$1,612/sf |
100 |
43 |
| Aug 28 |
181 |
$1,644/sf |
106 |
40 |
| Sep 4 |
179 |
$1,646/sf |
109 |
32 |
| Sep 11 |
177 |
$1,683/sf |
105 |
32 |
| Sep 18 |
169 |
$1,660/sf |
106 |
29 |
| Sep 25 |
183 |
$1,662/sf |
106 |
27 |
| Oct 2 |
180 |
$1,676/sf |
107 |
25 |
| Oct 9 |
190 |
$1,647/sf |
103 |
30 |
| Oct 16 |
185 |
$1,613/sf |
104 |
33 |
| Oct 23 |
181 |
$1,655/sf |
106 |
32 |
| Oct 30 |
184 |
$1,618/sf |
107 |
31 |
| Nov 6 |
172 |
$1,622/sf |
106 |
32 |
| Nov 13 |
170 |
$1,645/sf |
105 |
31 |
| Nov 20 |
174 |
$1,654/sf |
106 |
25 |
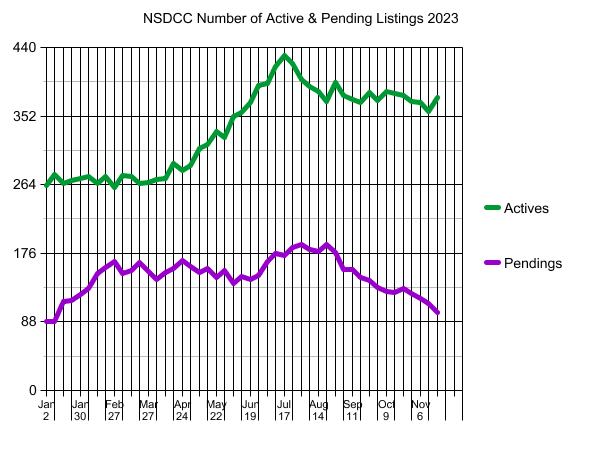
NSDCC Weekly New Listings and New Pendings
| Week |
New Listings |
New Pendings |
Total Actives |
Total Pendings |
| Jan 2, 2023 |
11 |
6 |
263 |
89 |
| Jan 9 |
36 |
15 |
277 |
88 |
| Jan 16 |
36 |
34 |
266 |
114 |
| Jan 23 |
36 |
22 |
269 |
116 |
| Jan 30 |
32 |
25 |
272 |
123 |
| Feb 6 |
46 |
33 |
275 |
131 |
| Feb 13 |
30 |
35 |
265 |
150 |
| Feb 20 |
43 |
34 |
274 |
158 |
| Feb 27 |
27 |
30 |
260 |
165 |
| Mar 6 |
45 |
28 |
276 |
150 |
| Mar 13 |
38 |
38 |
274 |
154 |
| Mar 20 |
39 |
37 |
265 |
164 |
| Mar 27 |
36 |
25 |
267 |
153 |
| Apr 3 |
37 |
28 |
271 |
143 |
| Apr 10 |
36 |
39 |
272 |
151 |
| Apr 17 |
47 |
27 |
291 |
157 |
| Apr 24 |
46 |
41 |
282 |
167 |
| May 1 |
59 |
31 |
288 |
159 |
| May 8 |
53 |
26 |
310 |
151 |
| May 15 |
48 |
31 |
315 |
157 |
| May 22 |
50 |
24 |
332 |
145 |
| May 29 |
43 |
37 |
325 |
154 |
| Jun 5 |
43 |
17 |
352 |
137 |
| Jun 12 |
52 |
36 |
357 |
146 |
| Jun 19 |
48 |
30 |
369 |
143 |
| Jun 26 |
65 |
26 |
391 |
148 |
| Jul 3 |
60 |
48 |
394 |
166 |
| Jul 10 |
51 |
34 |
415 |
176 |
| Jul 17 |
55 |
28 |
430 |
173 |
| Jul 24 |
37 |
43 |
419 |
184 |
| Jul 31 |
48 |
44 |
399 |
187 |
| Aug 7 |
43 |
32 |
390 |
181 |
| Aug 14 |
36 |
24 |
384 |
178 |
| Aug 21 |
41 |
45 |
371 |
187 |
| Aug 28 |
37 |
27 |
395 |
177 |
| Sep 4 |
35 |
29 |
378 |
155 |
| Sep 11 |
40 |
30 |
373 |
155 |
| Sep 18 |
37 |
29 |
369 |
145 |
| Sep 25 |
39 |
20 |
382 |
141 |
| Oct 2 |
44 |
31 |
372 |
132 |
| Oct 9 |
45 |
23 |
384 |
127 |
| Oct 16 |
31 |
23 |
381 |
126 |
| Oct 23 |
36 |
26 |
379 |
131 |
| Oct 30 |
28 |
17 |
371 |
125 |
| Nov 6 |
30 |
23 |
369 |
118 |
| Nov 13 |
29 |
16 |
358 |
112 |
| Nov 20 |
41 |
16 |
376 |
100 |
NSDCC Weekly LP Quartiles
| Week |
1st Quartile |
2nd Quartile (Median LP) |
3rd Quartile |
| Jan 2, 2023 |
$2,095,000 |
$3,695,000 |
$5,995,000 |
| Jan 9 |
$1,990,000 |
$3,495,000 |
$5,775,000 |
| Jan 16 |
$2,000,000 |
$3,574,000 |
$5,995,000 |
| Jan 23 |
$2,099,000 |
$3,595,000 |
$5,999,000 |
| Jan 30 |
$2,195,000 |
$3,525,000 |
$5,942,000 |
| Feb 6 |
$2,195,000 |
$3,598,000 |
$6,845,000 |
| Feb 13 |
$2,300,000 |
$3,795,000 |
$6,495,000 |
| Feb 20 |
$2,397,500 |
$3,950,000 |
$6,197,500 |
| Feb 27 |
$2,480,800 |
$3,970,000 |
$6,845,000 |
| Mar 6 |
$2,395,000 |
$3,749,500 |
$5,995,000 |
| Mar 13 |
$2,397,000 |
$3,772,500 |
$5,997,000 |
| Mar 20 |
$2,580,000 |
$3,995,000 |
$6,800,000 |
| Mar 27 |
$2,595,000 |
$3,995,000 |
$6,845,000 |
| Apr 3 |
$2,699,000 |
$3,995,000 |
$6,750,000 |
| Apr 10 |
$2,799,500 |
$4,074,997 |
$6,895,000 |
| Apr 17 |
$2,600,000 |
$3,995,000 |
$6,597,000 |
| Apr 24 |
$2,685,000 |
$4,074,997 |
$6,895,000 |
| May 1 |
$2,695,000 |
$3,999,000 |
$6,495,000 |
| May 8 |
$2,525,000 |
$3,849,949 |
$5,946,000 |
| May 15 |
$2,495,000 |
$3,749,400 |
$5,950,000 |
| May 22 |
$2,444,000 |
$3,695,400 |
$6,000,000 |
| May 29 |
$2,495,000 |
$3,699,000 |
$6,395,000 |
| Jun 5 |
$2,450,000 |
$3,641,500 |
$6,000,000 |
| Jun 12 |
$2,499,900 |
$3,799,999 |
$6,496,000 |
| Jun 19 |
$2,495,000 |
$3,750,000 |
$6,497,000 |
| Jun 26 |
$2,450,000 |
$3,799,000 |
$6,495,000 |
| Jul 3 |
$2,479,000 |
$3,891,500 |
$6,235,000 |
| Jul 10 |
$2,468,000 |
$3,900,000 |
$5,998,985 |
| Jul 17 |
$2,350,000 |
$3,669,000 |
$5,949,000 |
| Jul 24 |
$2,399,000 |
$3,799,999 |
$5,995,000 |
| Jul 31 |
$2,395,000 |
$3,888,000 |
$6,245,000 |
| Aug 7 |
$2,492,000 |
$3,895,000 |
$6,345,000 |
| Aug 14 |
$2,495,000 |
$3,995,000 |
$6,499,000 |
| Aug 21 |
$2,499,000 |
$3,995,000 |
$6,395,000 |
| Aug 28 |
$2,395,000 |
$3,850,000 |
$6,245,000 |
| Sep 4 |
$2,372,500 |
$3,957,500 |
$6,446,500 |
| Sep 11 |
$2,299,500 |
$3,995.000 |
$6,845,000 |
| Sep 18 |
$2,349,600 |
$3,995,000 |
$6,750,000 |
| Sep 25 |
$2,349,500 |
$3,991,500 |
$6,695,000 |
| Oct 2 |
$2,350,000 |
$3,995,000 |
$6,700,000 |
| Oct 9 |
$2,372,500 |
$3,999,450 |
$6,750,000 |
| Oct 16 |
$2,325,000 |
$3,995,000 |
$6,650,000 |
| Oct 23 |
$2,299,000 |
$3,995,000 |
$6,695,000 |
| Oct 30 |
$2,300,000 |
$3,999,000 |
$6,750,000 |
| Nov 6 |
$2,250,000 |
$3,888,888 |
$6,650,000 |
| Nov 13 |
$2,225,000 |
$3,893,444 |
$6,995,000 |
| Nov 20 |
$2,100,000 |
$3,805,000 |
$6,950,000 |


Without foreclosures there’s no downward pressure on home prices.
If all the sellers (illegally) unofficially collude with assistance from realtors prices will stay high.
It’s a weird equilibrium. Banks have to see what’s going on just like everyone else but as long as prices stay high nobody wants to rock the boat.
If you really want to see the effect of home prices always going up + everyone playing musical chairs with properties do some research into china’s ghost city’s. Without foreclosures this is the path we’re starting to walk down.
Without foreclosures this is the path we’re starting to walk down.
Indeed, and it will be a long road.
With virtually no downward pressure (no foreclosures, high employment, high equity, and everyone else in their forever home) sellers will just be waiting until the market comes up to meet them and their price.
To be fair, China’s “ghost cities” are also a consequence of shoddy financial controls on past purchases and central planning. Far too many Chinese residential purchases come with family extracting equity from their residential purchases and leveraging that to make more purchases. All leverage all the way down. And central planning? That’s as much a problem here as there. Their hand is just earlier and heavier.
@RobDawg
“It’s just money. It’s made up.”
– John Tuld