

NSDCC Listings, Jan 1 – May 15
Can we use statistics to describe the market conditions today?
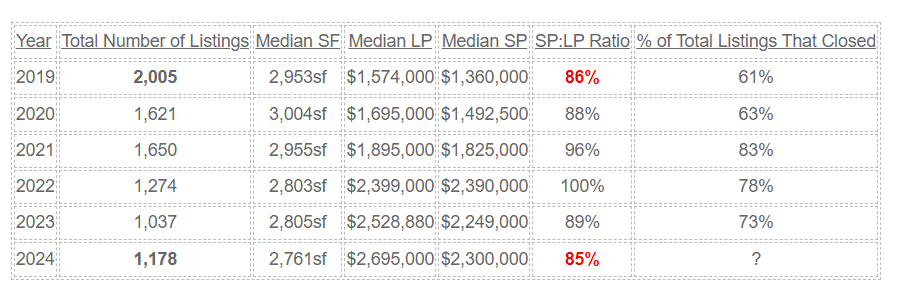
This chart above helps a little. Even though the number of listings is drastically lower than it used to be, apparently the market has been adjusting – mostly by price!
I mentioned that it seemed like everything is priced $200,000 more than it was last year, and the median list price reflects a similar number. Buyers aren’t taking the full plunge though, and the 85% SP:LP is a sign of normalizing (buyers having more negotiating power).
The frenzy that caused virtually everything to sell is long gone, and we’ll probably be back to having 30% to 40% of the listings not selling. This chart doesn’t show the number of refreshed listings where agents cancel and then re-input right away to “refresh” it – but be on the lookout. We will be seeing more of those this year.
Statistically, the market conditions look fairly healthy. Though different than the recent past!


0 Comments