An interesting phenomenon that has been occurring more lately is the delay in offers being submitted.
I’ve heard agents say it’s because people are being smarter about waiting until closer to the offer deadline so the listing agents have less time to shop them around, and that buyers are being more deliberate in checking their finances.
However, the more time that passes between the initial open house and the submission of offers, the less likely buyers will pay wildly over the list price….or even offer at all.
The pool of buyers who are willing to pay $500,000-$1,000,000 over list price has to be diminishing, and will it be long before the only buyers left are those who want to pay a fair price?
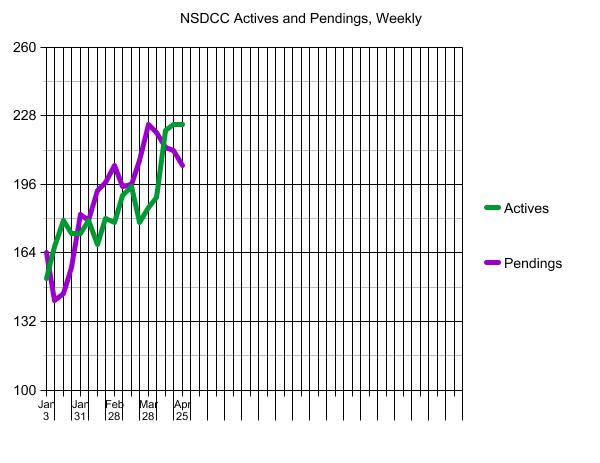
Typically there are a flurry of closings in the last week of the month. If there isn’t a corresponding uptick in new pendings this week, we could see the graph (at the top) look remarkably different next Monday!
~~~~~~~~~~~~~~~~~~~~~~~~~~~~~~~~~~~
The $0 – $1,500,000 Market:
| Date |
NSDCC Active Listings |
Avg. LP/sf |
Avg. DOM |
# of Pendings |
| Jan 3, 2022 |
9 |
$832/sf |
35 |
36 |
| Jan 10 |
9 |
$766/sf |
28 |
29 |
| Jan 17 |
13 |
$773/sf |
26 |
27 |
| Jan 24 |
9 |
$818/sf |
15 |
29 |
| Jan 31 |
14 |
$752/sf |
14 |
31 |
| Feb 7 |
13 |
$774/sf |
12 |
32 |
| Feb 14 |
11 |
$826/sf |
12 |
35 |
| Feb 21 |
7 |
$889/sf |
17 |
38 |
| Feb 28 |
12 |
$888/sf |
17 |
33 |
| Mar 7 |
9 |
$1,017/sf |
21 |
33 |
| Mar 14 |
14 |
$847/sf |
18 |
31 |
| Mar 21 |
8 |
$912/sf |
26 |
36 |
| Mar 28 |
10 |
$914/sf |
25 |
28 |
| Apr 4 |
10 |
$782/sf |
33 |
34 |
| Apr 11 |
19 |
$733/sf |
21 |
36 |
| Apr 18 |
16 |
$795/sf |
28 |
34 |
| Apr 25 |
18 |
$891/sf |
27 |
30 |
The $1,500,000 – $2,000,000 Market:
| Date |
NSDCC Active Listings |
Avg. LP/sf |
Avg. DOM |
# of Pendings |
| Jan 3, 2022 |
8 |
$842/sf |
52 |
36 |
| Jan 10 |
13 |
$751/sf |
28 |
29 |
| Jan 17 |
16 |
$736/sf |
33 |
27 |
| Jan 24 |
16 |
$801/sf |
17 |
27 |
| Jan 31 |
15 |
$696/sf |
14 |
34 |
| Feb 7 |
15 |
$765/sf |
17 |
34 |
| Feb 14 |
10 |
$726/sf |
19 |
38 |
| Feb 21 |
19 |
$715/sf |
15 |
39 |
| Feb 28 |
9 |
$660/sf |
12 |
46 |
| Mar 7 |
16 |
$789/sf |
15 |
46 |
| Mar 14 |
17 |
$837/sf |
8 |
44 |
| Mar 21 |
18 |
$867/sf |
11 |
43 |
| Mar 28 |
14 |
$838/sf |
15 |
48 |
| Apr 4 |
18 |
$762/sf |
25 |
42 |
| Apr 11 |
23 |
$774/sf |
15 |
39 |
| Apr 18 |
22 |
$792/sf |
17 |
41 |
| Apr 25 |
18 |
$810/sf |
20 |
41 |
The $2,000,000 – $3,000,000 Market:
| Date |
NSDCC Active Listings |
Avg. LP/sf |
Avg. DOM |
# of Pendings |
| Jan 3, 2022 |
18 |
$1,080/sf |
127 |
43 |
| Jan 10 |
23 |
$1,038/sf |
85 |
37 |
| Jan 17 |
26 |
$1,044/sf |
80 |
41 |
| Jan 24 |
28 |
$1,015/sf |
37 |
42 |
| Jan 31 |
22 |
$949/sf |
38 |
47 |
| Feb 7 |
26 |
$919/sf |
29 |
42 |
| Feb 14 |
22 |
$997/sf |
37 |
49 |
| Feb 21 |
21 |
$966/sf |
33 |
54 |
| Feb 28 |
26 |
$905/sf |
32 |
57 |
| Mar 7 |
29 |
$922/sf |
28 |
57 |
| Mar 14 |
20 |
$852/sf |
26 |
58 |
| Mar 21 |
17 |
$928/sf |
26 |
60 |
| Mar 28 |
34 |
$927/sf |
12 |
65 |
| Apr 4 |
32 |
$927/sf |
20 |
69 |
| Apr 11 |
44 |
$910/sf |
17 |
62 |
| Apr 18 |
48 |
$997/sf |
19 |
66 |
| Apr 25 |
42 |
$1,092/sf |
18 |
73 |
The $3,000,000 – $4,000,000 Market:
| Date |
NSDCC Active Listings |
Avg. LP/sf |
Avg. DOM |
# of Pendings |
| Jan 3, 2022 |
19 |
$1,230/sf |
90 |
26 |
| Jan 10 |
22 |
$1,210/sf |
76 |
25 |
| Jan 17 |
19 |
$1,207/sf |
86 |
23 |
| Jan 24 |
17 |
$1,129/sf |
92 |
24 |
| Jan 31 |
21 |
$1,172/sf |
70 |
22 |
| Feb 7 |
19 |
$1,169/sf |
67 |
25 |
| Feb 14 |
19 |
$1,234/sf |
65 |
28 |
| Feb 21 |
21 |
$1,279/sf |
69 |
28 |
| Feb 28 |
22 |
$1,214/sf |
64 |
25 |
| Mar 7 |
27 |
$1,295/sf |
60 |
24 |
| Mar 14 |
27 |
$1,201/sf |
65 |
27 |
| Mar 21 |
23 |
$1,282/sf |
69 |
31 |
| Mar 28 |
25 |
$1,253/sf |
67 |
30 |
| Apr 4 |
30 |
$1,199/sf |
61 |
27 |
| Apr 11 |
32 |
$1,174/sf |
62 |
31 |
| Apr 18 |
33 |
$1,216/sf |
68 |
31 |
| Apr 25 |
33 |
$1,219/sf |
63 |
33 |
The $4,000,000+ Market:
| Date |
NSDCC Active Listings |
Avg. LP/sf |
Avg. DOM |
# of Pendings |
| Jan 3, 2022 |
100 |
$1,884/sf |
128 |
30 |
| Jan 10 |
105 |
$1,864/sf |
113 |
29 |
| Jan 17 |
109 |
$1,763/sf |
110 |
34 |
| Jan 24 |
105 |
$2,130/sf |
114 |
42 |
| Jan 31 |
102 |
$2,114/sf |
118 |
53 |
| Feb 7 |
109 |
$2,000/sf |
108 |
50 |
| Feb 14 |
108 |
$2,005/sf |
109 |
47 |
| Feb 21 |
113 |
$2,008/sf |
103 |
43 |
| Feb 28 |
111 |
$1,991/sf |
101 |
47 |
| Mar 7 |
115 |
$1,904/sf |
91 |
39 |
| Mar 14 |
121 |
$1,893/sf |
95 |
43 |
| Mar 21 |
116 |
$1,905/sf |
97 |
44 |
| Mar 28 |
104 |
$1,966/sf |
97 |
59 |
| Apr 4 |
103 |
$1,929/sf |
97 |
56 |
| Apr 11 |
106 |
$1,906/sf |
97 |
55 |
| Apr 18 |
108 |
$1,874/sf |
100 |
51 |
| Apr 25 |
116 |
$1,829/sf |
97 |
38 |
NSDCC Weekly New Listings and New Pendings
| Week |
New Listings |
New Pendings |
Total Actives |
Total Pendings |
| Jan 3, 2022 |
17 |
14 |
152 |
164 |
| Jan 10 |
39 |
18 |
167 |
142 |
| Jan 17 |
34 |
29 |
179 |
145 |
| Jan 24 |
41 |
40 |
173 |
157 |
| Jan 31 |
43 |
40 |
173 |
182 |
| Feb 7 |
43 |
38 |
179 |
179 |
| Feb 14 |
44 |
49 |
168 |
193 |
| Feb 21 |
51 |
38 |
180 |
197 |
| Feb 28 |
39 |
39 |
179 |
205 |
| Mar 7 |
54 |
37 |
191 |
195 |
| Mar 14 |
48 |
51 |
195 |
196 |
| Mar 21 |
39 |
46 |
178 |
207 |
| Mar 28 |
53 |
50 |
185 |
224 |
| Apr 4 |
46 |
40 |
190 |
220 |
| Apr 11 |
61 |
39 |
221 |
213 |
| Apr 18 |
41 |
46 |
224 |
212 |
| Apr 25 |
50 |
43 |
224 |
205 |


From the same ‘experts’ who said rates will be in the high-3s by the end of 2022…..
Most people think the current rise in mortgage rates is more than just a blip on the radar, as both homeowners and renters expect rates to steadily increase over the next three years. Industry experts, on the other hand, aren’t so sure.
Most households expect the interest rate on a 30-year fixed-rate loan to increase to 6.7% next year and reach 8.2% by 2025, according to a housing survey released by the New York Federal Reserve this week. If those expectations come true, it would be the first time the average 30-year rate crossed 8% since the year 2000.
The expectation of much higher rates is easy to understand given the current mortgage rate environment. The average rate for a 30-year loan has risen sharply since the beginning of the year, increasing by nearly two percentage points to the current level of 5%. Consumers tend to see these trends and expect them to continue into the future, notes Lawrence Yun, chief economist for the National Association of Realtors.
“Rates have been rising and could rise more in coming years,” he says. “So, the mindset from some consumers is that rates will reach 8% by 2025, but, of course, that remains to be seen.”
The possibility of rates increasing that high exists, of course. However, an 8% interest rate by 2025 is unlikely, says Ralph McLaughlin, chief economist at Kukun, a real estate and data analytics firm.
Melissa Cohn, regional vice president at William Raveis Mortgage, believes the only way rates might go up to 8% would be if the Federal Reserve’s current plans to fight inflation have no effect, causing the Fed to then raise short term rates to levels not seen in years.
Under this unlikely circumstance “it is possible that [mortgage] rates could get to 8%, but at that level, the economy will certainly cool off,” she says. “When that happens, rates will come back down to affordable levels.”
While consumers may be preparing for significantly higher rates over the coming years, industry experts are more tempered in their expectations. NAR is forecasting the 30-year rate to average between 5% and 5.5% throughout most of 2023.
“As the Fed raises interest rates, the mortgage market will simply yawn,” says Yun, explaining that the mortgage market has already factored in all the Fed rate hikes possible this year.
The Federal Reserve doesn’t directly set mortgage rates, but it does influence them by establishing monetary policy to control inflation and keep the job market running smoothly. One of the main tools to do this is the federal funds rate — a short term rate banks charge each other. As this rate goes up, so do mortgage rates. But the central bank has so far taken a cautious approach.
“The Fed has shown they are more than willing to let the economy run a little hot [rather] than raise rates excessively and risk a recession,” says McLaughlin. “As such, I expect 8% to be near the upper bound of where mortgage rates will settle over the next three to five years.”
Although the NAR doesn’t have a forecast out to 2025, Yun expects rates to stabilize around 5.5% over the next few years.
Other mortgage experts agree that rates won’t get as high as consumers are anticipating. The Mortgage Bankers Association is actually expecting rates to average 4.8% by the end of this year and to steadily decrease to an average of 4.6% by 2024.
The forecasted decrease is a result of stabilizing yields on the 10-year Treasury note, which are closely tied to mortgage rates. The MBA expects those yields to steady at around 2.8% by the end of this year and hold at that rate through 2024, when yields are expected to fall to 2.5%. (There tends to be a 1.8 percentage point spread between the 10-year Treasury and average mortgage rates.)
Freddie Mac’s also expects lower rates rather than higher rates in the short term. According to their most recent forecast, the 30-year rate will average 4.6% during 2022, increasing to average 5% during 2023.
https://money.com/mortgage-rate-forecasts-consumers-vs-experts/