

We’re going to be fed a solid diet of ivory-tower analyses from now on, because when you look at the history, it sure seems like home prices are due to come down. What these authors fail to consider is how the Bank of Mom and Dad has made the current pseudo-bubble possible, and will continue to do so. Plus, for prices to go down, you must have sellers who are willing to dump on price. None have been that motivated, at least not yet.
This article can’t even get the facts straight – the last bust was caused by exotic neg-am financing exploding in our faces, and ill-informed homeowners bailing out. In addition, you can draw the trendline anywhere you want, and these authors drew it where it would produce the most drama – see above – yet their worst-case scenario is only back to 2013 prices. We’d survive that.
http://journal.firsttuesday.us/home-prices-run-away-from-incomes-for-now/64911/
This most recent cycle we are emerging from in 2018 has its roots in the early 2000s, when home values began outpacing incomes at a rapid pace.
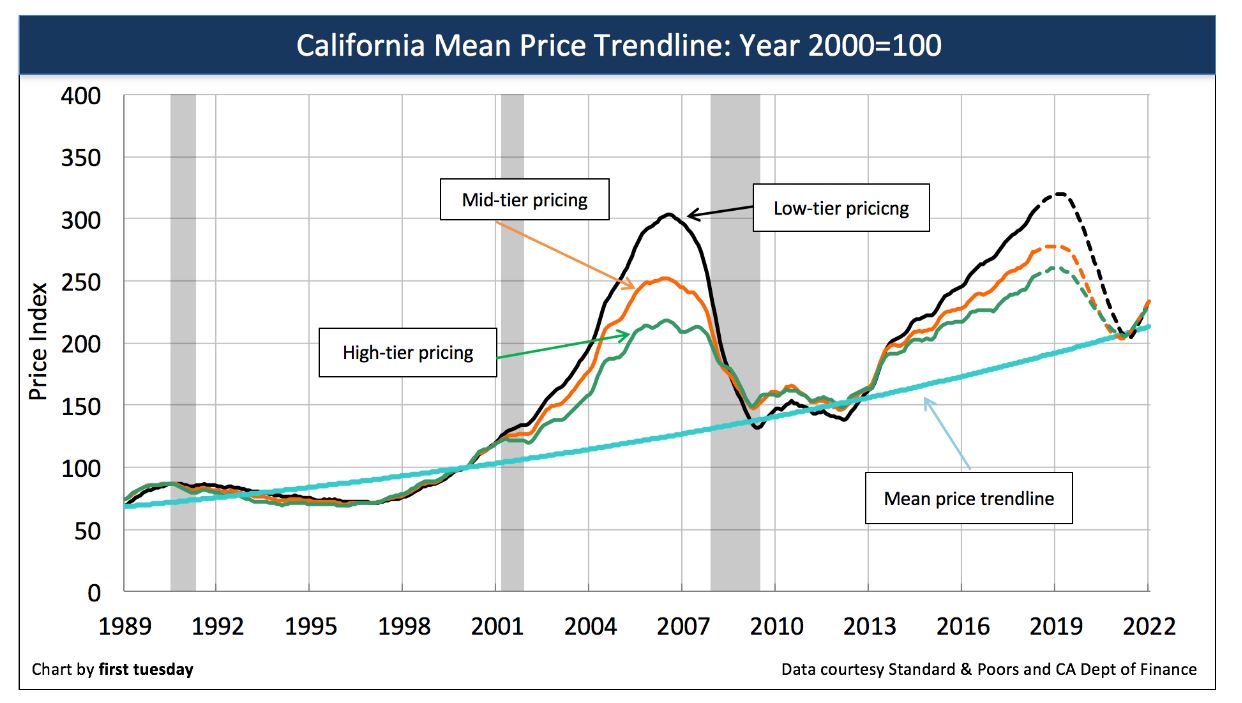
In 2006, home prices peaked in step with the Millennium Boom. By that time, home sales volume was already falling as buyers sensed prices were too high to continue during the inevitable recession, which arrived in 2008. From 2006 to 2007, prices dropped 16%, followed by a further 26% in the following year.
All in all, California home prices fell 44% from their 2006 peak to their bottom in 2009.
In some ways, this steep fall was a correction to all the excess experienced in the housing market during the early- and mid-2000s. In another sense, the fall was simply the market’s way of bringing home prices back in line with incomes.
There is a name for this reliable force that pulls home prices toward incomes: the mean price trendline.
Through the volatility of housing booms and busts, price increases continue to return to the same rate of annual income change, related to the consumer price inflation (CPI), which is typically 2%-3% per year. In California, this mean price change is closer to 3.5% annually over the past several decades.
How does income impact home prices?
Quite simply, home values can only go as high as incomes allow.
Homebuyers reliant on financing are limited to a maximum mortgage payment of 31% of their monthly income. This translates to the ability to purchase a home costing roughly five times their annual income.
Still, there is some wiggle room in the equation. After incomes, interest rates have the next biggest impact on home prices. When interest rates are falling — as occurred in the 2000s — buyer purchasing power is extended, as homebuyers’ mortgage payments go further. When interest rates rise — as is occurring in 2018 — buyer purchasing power falls and homebuyers are limited to paying less with the same income.
During housing bubbles, home prices become temporarily untethered from this rule and the mean price trendline. During the bust that follows the boom, prices fall, returning once again to the trendline.
2018 is primed for the next downturn
Here’s how the situation stands in mid-2018:
- home prices are roughly 9% above a year earlier;
- home sales volume is 1% above a year earlier (basically flat);
- interest rates are nearly a full percentage point higher than a year earlier, translating to a 7% reduction in purchasing power for the average California homebuyer.
Further, the Federal Reserve (the Fed) plans to continue their efforts to increase interest rates in an effort to cool down the economy and induce a moderate business recession by 2020. Not only do higher interest rates discourage potential homebuyers from entering the market, but they cause homebuyers to offer less when they make an offer to purchase.
In response, first tuesday expects home prices to fall by mid-2019, bottoming once they hit the mean price trendline around 2020. Meanwhile, incomes will continue along at their current measured pace, pausing briefly in 2020-2021 in response to the recession.
Link to Article


They also fail to mention that new home construction has and is failing to keep up with household formation.
IMO I think we will see flat pricing (within 5 to 10 %) for a few years.
Excellent summation!
I’ve been commenting on the C-S HPI for since it came out. There are two huge problems with it. C-S ignores interest rates and ignores changes in the median type of home. The median home since 1989 has gotten larger and more appointed. The net effect being the median line should be steeper and more curved. The consequence being we aren’t anywhere near as off track as this graph suggests.
Another way to look at this visually is that the area under and over the median curve should have similar areas. This curve is biased to undervalued.
“The median home since 1989 has gotten larger and more appointed. ”
You mean increased square footage?
I dunno if those are accountable real variables. Seems like it would roughly the same as the valuation of a car. They’re a hell of a lot different from a decade ago. How do you price for it, while acknowledging multiple variables, and figuring only those that are worth measuring?
The trend line is like a magnet. The longer it traces back, the less pop variables influence it, imo.
And welcome back, Jiji!
IMO I think we will see flat pricing (within 5 to 10 %) for a few years.
Me too, with the vastly-superior homes selling for a hefty premium. Those will make everyone think we’re back on track, only to be disappointed when the dogs still bark at traffic.
You mean increased square footage?
More square feet, more appointments, more electrical capacity, more urban services, more everything. C-S goes back to 1889. Just so you know I’m not mistyping; since 1889. Yup the median index home from 1889 is being compared to 2018.
It’s probably good that the home-value measuring is so vague. Because when people see the right house at the right time, they just buy it.
Price is an annoying side argument that leads to bruised shins only.
1.) Take bottom-left-to-upper-right graph.
2.) Draw dotted lines to show a U turn then top-left-to-bottom-right direction.
3.) Write article supporting that “analysis”.