My graphs are focused on North San Diego County's coastal region (La Jolla to Carlsbad) and Rich covers the whole county with his data. Get more of his scoop here: https://www.piggington.com/july_2020_housing_data_inventory_hits_new_low
Rich Toscano
Rich’s Report
I agree with Rich about pricing, and we are too deep into the year for it to change much now. There will be occasional deals, but for the most part, sellers will just wait until spring rather than give it away....
Navigating the SD Bubble
Rich has done a fantastic summary on the San Diego real estate bubble - read more here: https://www.piggington.com/shambling_tiny_halting_step_towards_affordability
Relatively-Low Inventory
Rich's latest graphs are out, and this inventory history above shows how relatively few homes are for sale locally. The median detached-home list price for the county today is $849,000! He did mention a reader's theory that in the era of online search portals, the...

Rich Data
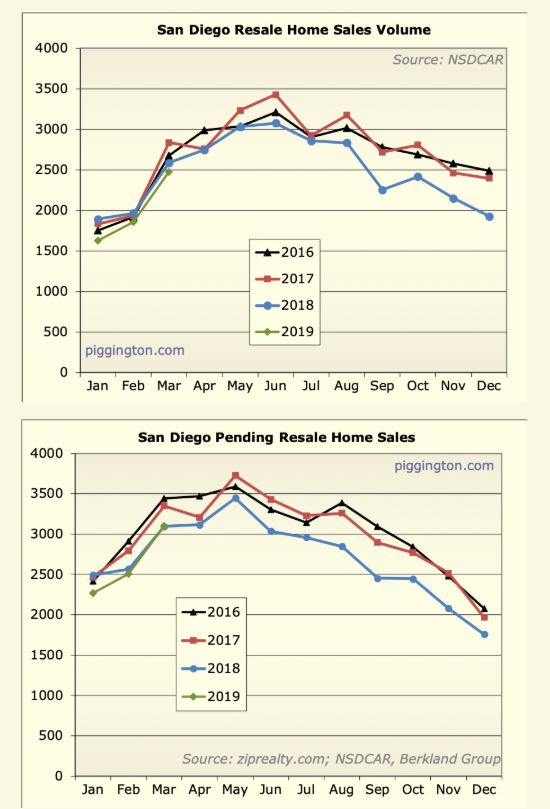
Rich's latest data is up at www.piggington.com. He mentioned the slightly-negative turn in pricing last month, but I like these two graphs above. The pricing trend is going to bounce around - as long as we have sales counts close to previous years, we'll be fine.
Rich’s Latest
Rich's latest assortment of data and graphs are out: https://www.piggington.com/december_2019_housing_data_highest_monthsinventory_2011_prices_d Here's one graph that demonstrates the timing of the selling season: For sales to spike in March, it means buyers have been...
The Latest From Piggington
Rich's latest report - we need to get used to bloated higher inventory counts: Read the full article here - with 13 more graphs! Link to...
Months of Active Inventory
Rich's latest report is out! The worrisome spike last month did flatten out, but it does make you wonder if we should adjust our sights. I agree with Rich that the months of active inventory will probably be rising from now on. But if the coastal market had 3 or...
Rich’s Take
More here: https://www.piggington.com/august_2018_housing_data_cooling_market
Low Rates And High Valuations
This is just a snip of Rich's latest post - read the full article here:


