We attended the Adams Avenue Unplugged last weekend in Normal Heights, and it was a great time. We walked down to the A/C Lounge to see Chickenbone Slim & the Biscuits:
and then back to the Normal Heights Methodist Church in time to see John Doe play solo. Tony Hawk is a big fan too – that’s him over the shoulder of the lady in the black-and-white-stripe top:
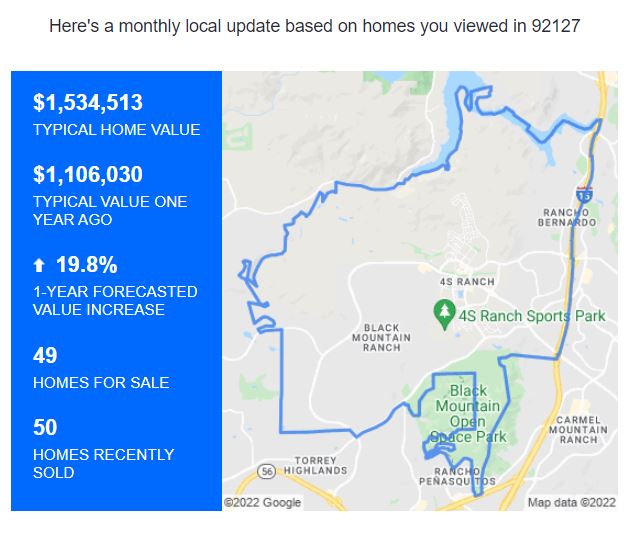
Last year’s frenzy was crazy because of the volume – there were enough listings to drive sales higher than usual. This year we don’t have as many listings, and it is driving the pricing to astonishing heights:
NSDCC Sales and Pricing, April
Year
NSDCC Detached-Home Sales
Median LP
Median SP
SP:LP Ratio
2015
284
$1,100,000
$1,077,500
98%
2016
303
$1,157,075
$1,125,000
97%
2017
276
$1,332,500
$1,281,065
96%
2018
270
$1,304,450
$1,285,225
99%
2019
265
$1,399,000
$1,375,000
98%
2020
156
$1,424,499
$1,390,000
98%
2021
359
$1,799,900
$1,825,829
101%
2022
221
$2,395,000
$2,600,000
109%
The median sales price is 42% higher than it was last April.
If listings dry up further, prices could keep rising!
This house is on a 1.06-acre lot and fixers in this area have been hot, so I guess that’s enough reason to pay over list. I’m sure they will get the last laugh when they build 2-3 houses and sell them for $8 million each.
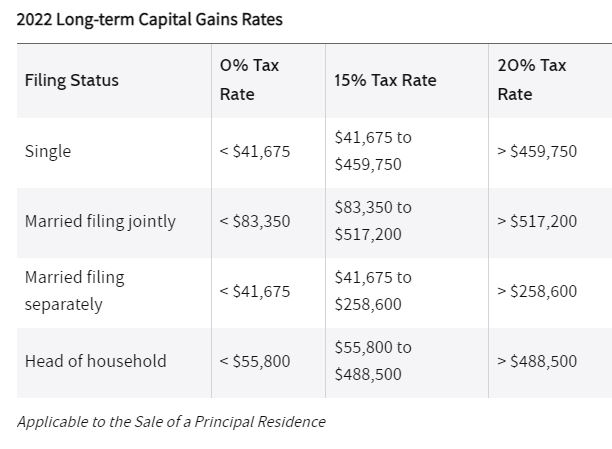
The big concern for long-time homeowners today is having to pay capital-gains tax on the net profit that’s ABOVE the exempted $500,000 for married couples. While the 2-out-of-5-year rule that was passed in 1997 is due for some adjusting, there haven’t been any indications that the politicians will re-visit the issue.
What can homeowners do to minimize the tax owed?
Document Your Expenses. All home improvements (not repairs) and closing costs are added to your home’s cost basis (purchase price), which help to minimize the taxable gain.
Carry the Financing. Have a big equity position and don’t need all the money? Take payments from the buyer over time, instead of receiving all the cash at closing. Require a big down payment so you would receive a nice chunk up front, and then collect on a 5% mortgage over the next 5-10 years. You only pay tax on the money received, so structure it so you drop down into the 15% tax bracket for the first year:
Rent it out for a year and do a 1031 Exchange. After renting your home out for a year, you could trade it for another rental property and postpone the capital-gains tax indefinitely. You have to rent out the new home too for at least a year before occupying as your residence, so it is a 2+ year project – but hey, no tax! If you don’t need to live there, another alternative is to buy a property in an ‘opportunity zone’. Investors begin to enjoy a step up in basis after 5 years. After 10 years, the gains become tax-free!
Offset with capital losses from elsewhere. Business and stock losses can be included in the same tax return to offset the capital gains.
Move every time your net gain rises up to $500,000. You may have to take a hit this time, but to avoid having to pay capital-gains tax again in the future, move more often. 🙂
Dying correctly. The burden of being the remaining spouse after a full life together can be devastating, but at least he/she will have the cost basis increased to the home’s value on the day of death – with no capital-gains tax owed. Make sure to have your family trust named as owner of the home.
Wait until your home’s value goes down. This isn’t likely to happen, so focus on 1-6 above!
Virtually every long-time homeowner has seen their equity rise enough in the last 12 months to cover their tax exposure, and didn’t that feel like free money? Instead of fretting over having to pay the government, just enjoy the ample amount left over – you made more than they did! Or utilize the tips above.
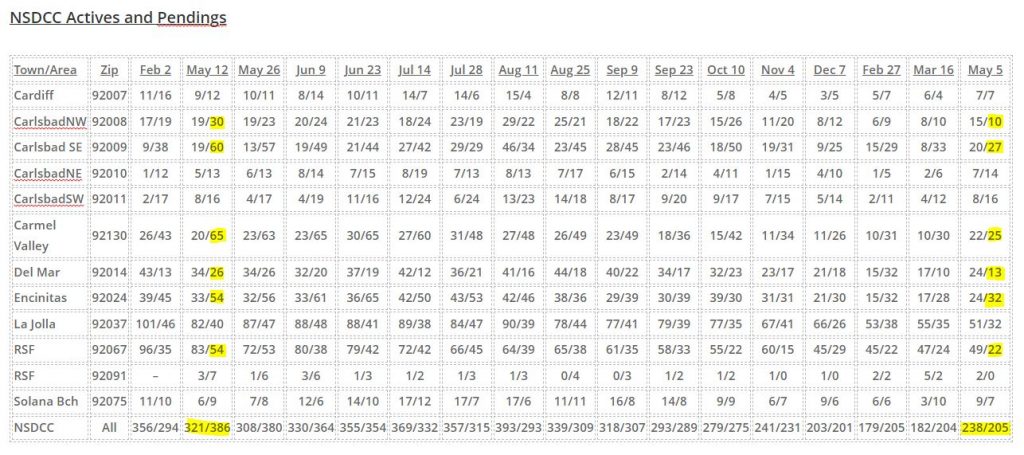
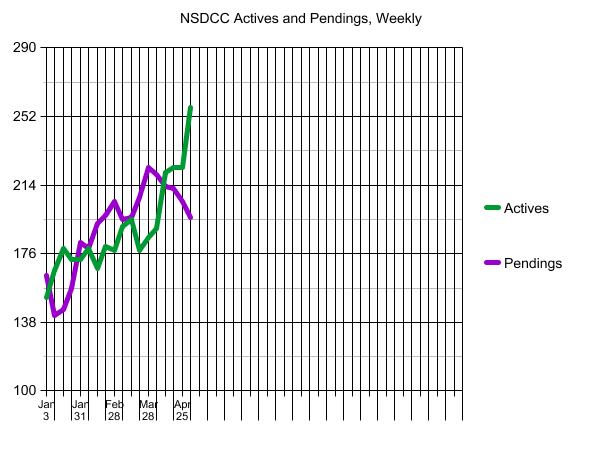
Yesterday we saw how the NSDCC active listings shot up from 224 to 256 in one week!
The count was at 190 just a month ago.
But to keep it in perspective, let’s compare it to previous years:
NSDCC Active & Pending Listings, First Week of May
Year
NSDCC # of Active Listings
NSDCC # of Pending Listings
A/P Ratio
2019
970
364
2.6:1
2020
732
208
3.5:1
2021
333
372
0.9:1
2022
256
196
1.3:1
It is a startling change in the marketplace when choices are so few. But relative to the corresponding number of pendings, the health of the market looks fine, in spite of much-higher pricing.
(We’ve considered a 2:1 ratio between actives and pendings to be a healthy market)
We hoped there would be a surge of new listings in 2022 as the pandemic winds down, but it’s not happening. Here are the total counts of new listings in the first third of the year:
NSDCC New Listings, January-April
Year
NSDCC # of New Listings
Median List Price
2019
1,771
$1,579,000
2020
1,370
$1,699,000
2021
1,372
$1,896,500
2022
981
$2,500,000
The monthly counts this year are 221 listings in January, 215 in February, 279 in March, and 266 in April. Fewer listings in April, than in March? No wonder the median list price is 32% higher this year than last!
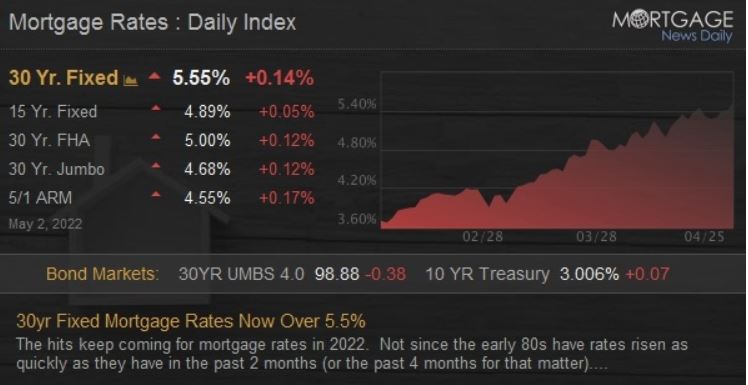
Rates are getting so far ahead of where they should be that there should be some relief once the Fed bumps their fed-funds rate by one-half percent this week. But we’ll probably end up touching 6% in the next 1-3 months.
From the MND:
The hits keep coming for mortgage rates in 2022. Not since the early 80s have rates risen as quickly as they have in the past 2 months (or the past 4 months for that matter). Less than 6 months ago, some lenders were still quoting top tier conforming 30yr fixed rates just under 3%. As recently as early March, those same rates were still in the high 3’s at times. Now today, the average lender is easily over 5.5%.
Today’s new installment of pain isn’t readily attributable to any new development. In fact, the entirety of the rate spike only has a few basic ingredients (discussed most recently HERE), but a long time frame in which to play out. That process should receive some important new information this week when the Fed unveils details about its balance sheet normalization plans.
“Normalization,” in this context, is just another way that the Fed will buy fewer bonds (Fed bond buying is one factor that kept rates as low as they were). We know the announcement is coming. We just don’t know how quickly the bond-buying reduction will occur. This will happen on Wednesday afternoon. Between now and then (and afterward as well!), rate volatility remains probable.
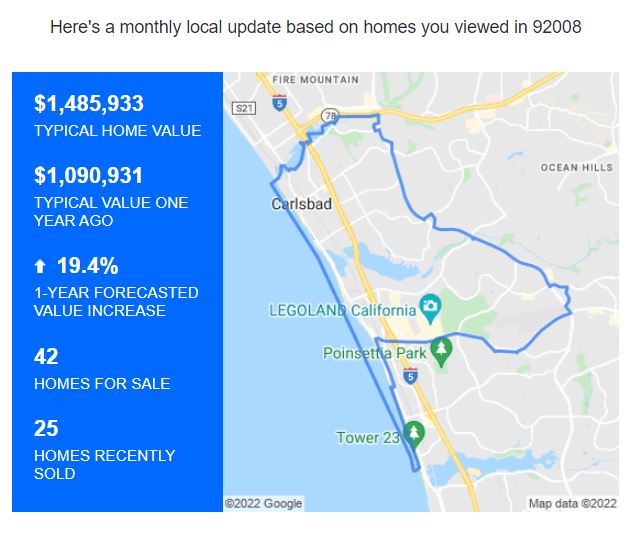
At some point over the last 6-12 months, Zillow started revising their zestimates higher – way higher!
It has been noticed too, and now virtually every potential seller brings their zestimate to the table, and expects to list their home for that amount……or more.
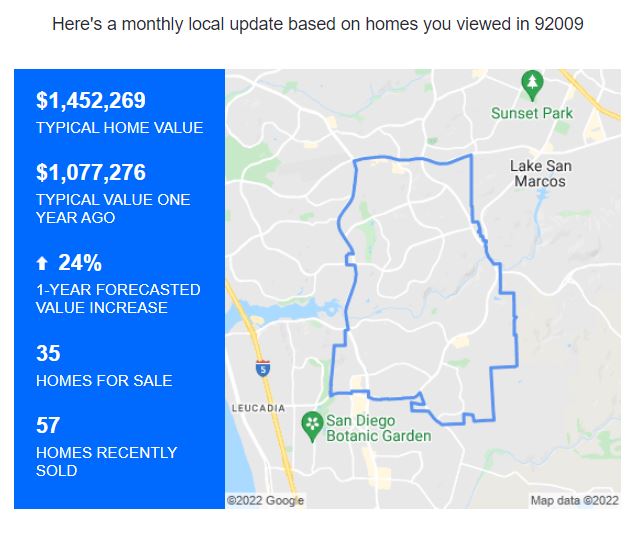
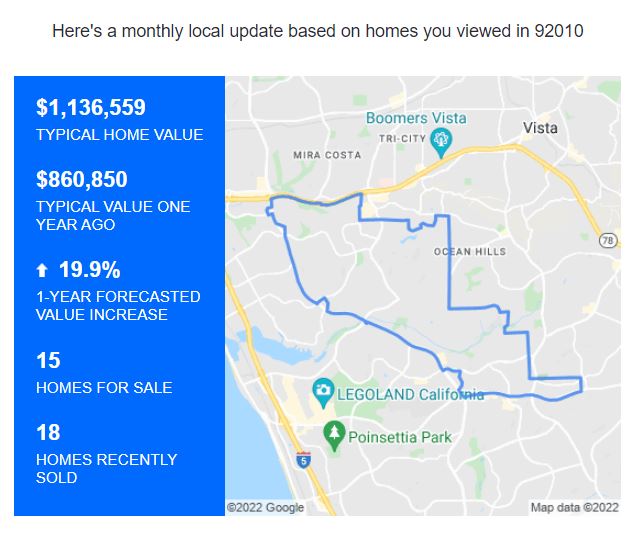
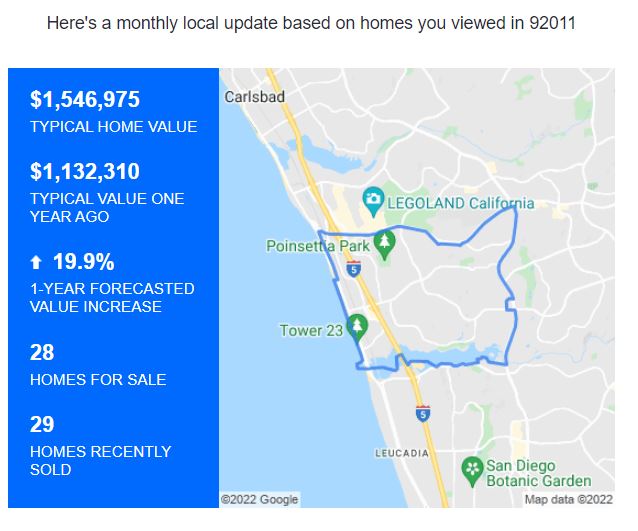
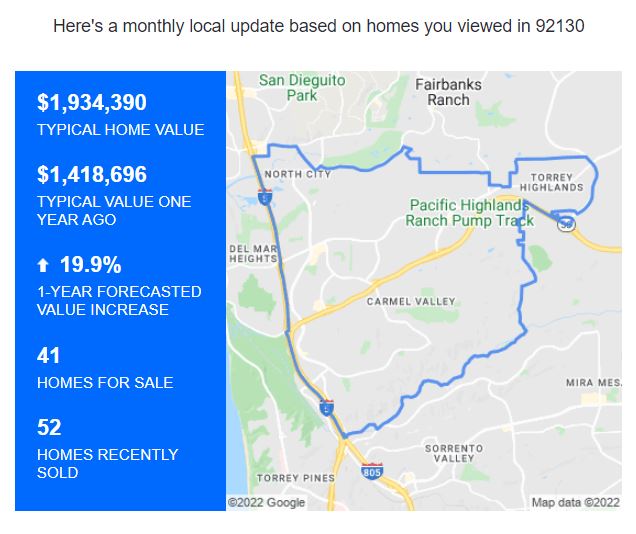
But in the latest Zillow forecasts by zip code, they have SCALED BACK their big percentage increases!
Are they scaling back the zestimates too? If not, the list pricing for the rest of 2022 will be frothy.
Here are their current forecasts, with the previous forecast beside each zip code:
They do have something that none of the ivory-tower economists have – the real estate viewer data.
They have lowered their local 1-year pricing forecasts by 5% to 11% in every zip code, which must be resulting from their algorithms sizing up the customer viewing data….doesn’t it?
Are they lowering the zestimates too?
It is hard to track because once a home goes on the MLS, their zestimate is automatically adjusted to within a couple of bucks of the list price. But are consumers – sellers and buyers – aware of that? No, and not even the agents know it. Everyone will wonder if the zestimate is legit, and they want to believe in something.
If we see more active (unsold) listings stacking up, we can attribute some, or all of it to the list pricing being based on the zestimates taken from earlier this year……..and sellers believing that they mean something! And then if they check their latest zestimate, it will be the same as their current list price, which will embolden them to think that the lucky young couple with 2.2 kids is right around the corner.
In the last week, there were 76 new listings between La Jolla and Carlsbad, which was the most since last August. The 37 new pendings were the fewest since mid-January!
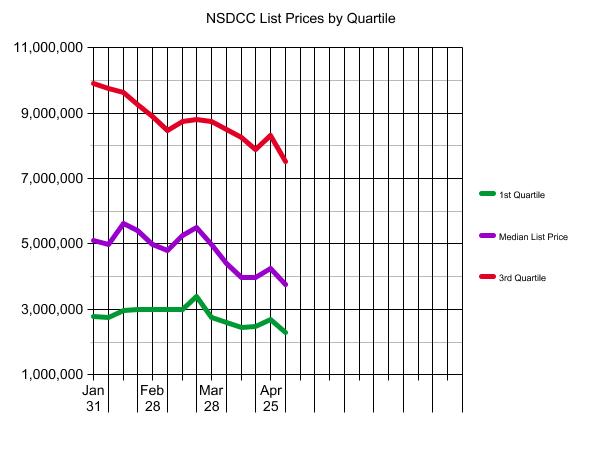
Rob Dawg suggested that we track the list prices by quartile:
What this graph doesn’t reflect is the hyper-optimism of recent sellers – have you noticed how high-priced the new listings have been over the last couple of weeks? It will be why the number of active (unsold) listings should keep rising, because they didn’t get the memo and will wait for weeks/months to test out their optimism.
A lady built this gorgeous coastal home with big ocean view and then unfortunately passed away. Once this sale closes, the entire proceeds will be given to the Rancho Coastal Humane Society:
Trustindex verifies that the original source of the review is Google.
We sold a home with Jim and Donna and from beginning to end they were consummate professionals. Their initial walk through the property resulted in a list of items to be repaired or updated. They supplied a list of vendors and job quotes to do the repairs and updates. We originally wanted to sell ‘as is’ and just get it over with. They gave us a selling price for ‘as is’ and options for doing a few updates/repairs to doing it all with the selling price for each option. We agreed to do all they suggested and we sold for the exact price they predicted. For every dollar spent we got back more than $2 back in the selling price. And they got that price in a rising interest rate environment! Donna and Jim are extremely detailed and guide you through ever aspect of the sale. There were no surprises thanks to their guidance. We couldn’t be more pleased with their representation.
Thank you Donna and Jim,
Jerry and Mary
Heather Quejada
March 27, 2025
Trustindex verifies that the original source of the review is Google.
We have known Jim & Donna Klinge for over a dozen years, having met them in Carlsbad where our children went to the same school. As long time North County residents, it was a no- brainer for us to have the Klinges be our eyes and ears for San Diego real estate in general and North County in particular. As my military career caused our family to move all over the country and overseas to Asia, Europe and the Pacific, we trusted Jim and Donna to help keep our house in Carlsbad rented with reliable and respectful tenants for over 10 years.
Naturally, when the time came to sell our beloved Carlsbad home to pursue a rural lifestyle in retirement out of California, we could think of no better team to represent us than Jim and Donna. They immediately went to work to update our house built in 2004 to current-day standards and trends — in 2 short months they transformed it into a literal modern-day masterpiece. We trusted their judgement implicitly and followed 100% of their recommended changes. When our house finally came on the market, there was a blizzard of serious interest, we had multiple offers by the third day and it sold in just 5 days after a frenzied bidding war for 20% above our asking price! The investment we made in upgrades recommended by Jim and Donna yielded a 4-fold return, in the process setting a new high water mark for a house sold in our community.
In our view, there are no better real estate professionals in all of San Diego than Jim and Donna Klinge. Buying or selling, you must run and beg Jim and Donna Klinge to represent you! Our family will never forget Jim, Donna, and their whole team at Compass — we are forever grateful to them.
Lou F
March 27, 2025
Trustindex verifies that the original source of the review is Google.
WeI had the pleasure of working with Klinge Realty Group to sell our home in Carmel Valley, and I cannot recommend them highly enough!
Jim and Donna demonstrated exceptional professionalism, offering expert guidance on market conditions and pricing strategy, which resulted in a quick and successful sale.
Communication was prompt and we were well-informed throughout the entire process.
For anyone looking for a dedicated and knowledgeable real estate team, look no further!
---
William Sams
March 25, 2025
Trustindex verifies that the original source of the review is Google.
Donna and Jim Klinge of Klinge Realty Group have our highest possible recommendation. From Donna and Jim’s first visit to our house through closing their advice and counsel was candid and honest in all dealings. They kept us fully informed throughout the process. The house sold less than three days after listing with a two-week closing. My wife and I have sold several houses during our lives. This was by far the best experience. Klinge Reality is a premium service realtor. You can’t make a better choice for someone to sell your home fast and for top dollar.
Emily Hernandez
December 29, 2024
Trustindex verifies that the original source of the review is Google.
Donna and Jim provided exceptional support and professionalism throughout the entire process. We couldn't have been happier with their efforts. They made our house shine, and thanks to their expertise, it sold above the listing price in the very first weekend! Truly a fantastic experience from start to finish.
Jesus Adrian Sahagun
November 11, 2024
Trustindex verifies that the original source of the review is Google.
This year has been difficult on our family, mainly due to having to sell our home. Thankfully we knew God had a plan for us and working with the Klinge team was a key part of it. It was an obvious decision to work with them again after such an amazing experience when purchasing the same home we needed to sell. The challenge was, how will we do this in so little time with so much going on? Jim and Donna held our hand every step of the way. Whenever an unexpected issue arose they found and provided a solution. Never once did we feel pressured to make a decision and the Klinges were always reassuring after providing the information that the decision was ours to make. Despite the curve balls, they never panicked and exemplified the “can do” attitude, making us feel optimistic and taken care of. Their expertise and professionalism was superb. But of all the reasons to work with the Klinges, the most impactful and valuable is their compassion and genuine care for their clients. We pray that we can one day purchase our forever home and you better believe that Jim and Donna will be representing us - as long as they will have us of course. Thank you again Klinge team! Your execution, experience, and care are unmatched.
SABIHA PASHA
July 23, 2024
Trustindex verifies that the original source of the review is Google.
Jim and Donna were fantastic! Jim understanding my needs, recommending potential places, pointing out the pros and cons of each property was invaluable. Then when the offer was accepted Donna’s organized guidance through the inspections, paperwork etc made the whole process seem effortless.
So grateful that I had them on my side!
Anu Koberg
July 13, 2024
Trustindex verifies that the original source of the review is Google.
We first found Jim through his blog at bubbleinfo.com, which really showcased his knowledge of SoCal real estate. Since then we've done three transactions with Jim and Donna, and they are an incredible full service agency, with Jim's deep market insight and Donna's deft contract and project management. We trust them implicitly in their analysis and strategy, which is based on years of experience. They're always available and on top of things, and we strongly recommend them to anyone.
Bjorn Isachsen
July 10, 2024
Trustindex verifies that the original source of the review is Google.
The Good
The Klinge Realty Group operates like a finely tuned machine, with a very personal touch. We contacted them on a Sunday and they were talking to us about our family and our needs on our living room couch the following day. They carefully listened to us and worked with us to identify the best and quickest path to listing within 2 weeks to take advantage of the low inventory conditions in our South Carlsbad neighborhood. They knew our tract specifically and had many previous sales there over the years - they came prepared with a thorough analysis of comparative sales and recommended a pricing strategy that they felt confident would yield offers the first weekend on the market.
The Great
Over the next two weeks Donna coordinated a range of vendors who she knew from experience could get the preparation to list work we needed done on time and with high quality. Our light tune-up involved excellent experiences with their stagers, landscapers, contractors, electricians, and plumbers. Throughout this period Donna's daily communication was clear, concise, and responsive. Any time we had questions Donna picked up the phone or texted immediately - but almost always, she answered our questions before we even knew we had them.
The Outstanding
We had a tricky situation with a shared fence that could have delayed our escrow. Donna used superb mediation skills to negotiate the terms of replacement and was personally on site with the fence contractor to make sure everything went smoothly. The fence looks great and escrow closed on time.
The Truly Exceptional
Our house came on the market on a Wednesday and between then and Monday morning Jim was personally at all three open houses. He was in constant communication explaining potential buyer reaction and strength. As he predicted offers began to come in on Saturday and each one was incrementally higher than the last. At the end we had 5 offers, 4 of which were over list, and the final accepted offer was $100,000 over list. In addition to being over list it included rent back terms that met our needs.
The Recommendation
For all of these reasons we would strongly recommend The Klinge Team to anyone wanting to sell in North County Coastal San Diego. I had been reading Jim's bubbleinfo.com blog for 15 years and knew when the time came to sell that he would be our first call. Jim Klinge is not your standard realtor. He is keenly aware of market conditions and sales strategies. And, works his tail off - though not as hard as Donna . At this point he's gone from realtor to friend and I plan to have him over to grill and chill at our new place to talk real estate, but also just about life and raising kids in San Diego. He's more interested in relationships than his sales numbers - and that's why his sales numbers are so high. We have already recommended the Klinge's to some close friends and another successful sale is on deck right around the corner...
Chris Shea
June 21, 2024
Trustindex verifies that the original source of the review is Google.
We recently had the pleasure of working with Jim and Donna from Klinge Realty Group to sell our house, and we couldn't be more satisfied with the experience. From the initial meeting, they listened attentively to our needs and provided invaluable guidance on specific improvements to get our home market ready.
Their responsiveness throughout the entire process was truly impressive. Anytime we had questions or concerns, they were quick to address them, ensuring we felt comfortable and informed every step of the way. What stood out the most was their team and extensive network of tradespeople, which made addressing any necessary repairs or updates seamless and stress-free.
Thanks to their expertise and dedication, our house sold quickly and at a great price. We highly recommend Jim and Donna to anyone looking to buy or sell a home. They are a fantastic team who truly care about their clients and deliver exceptional results.