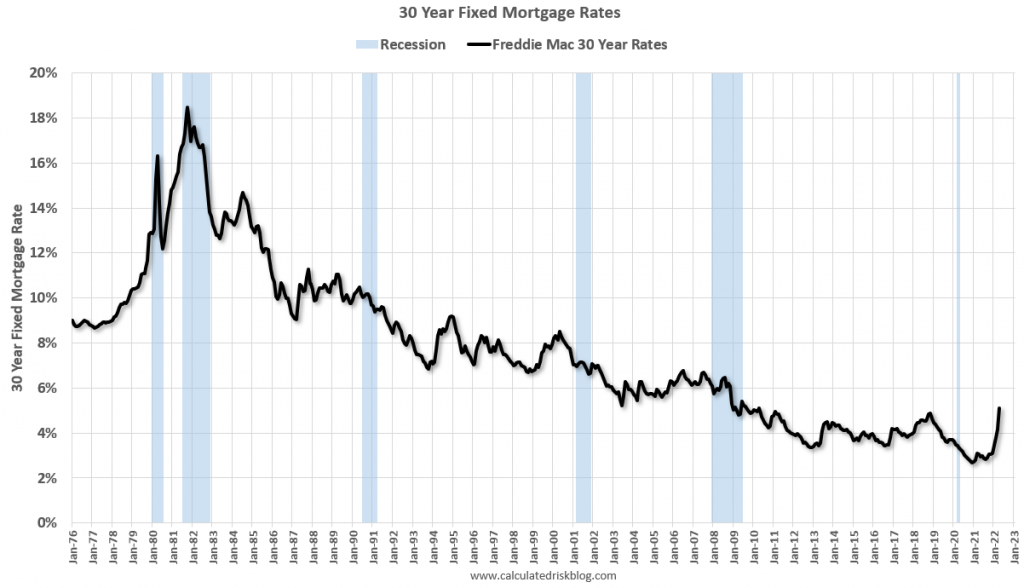
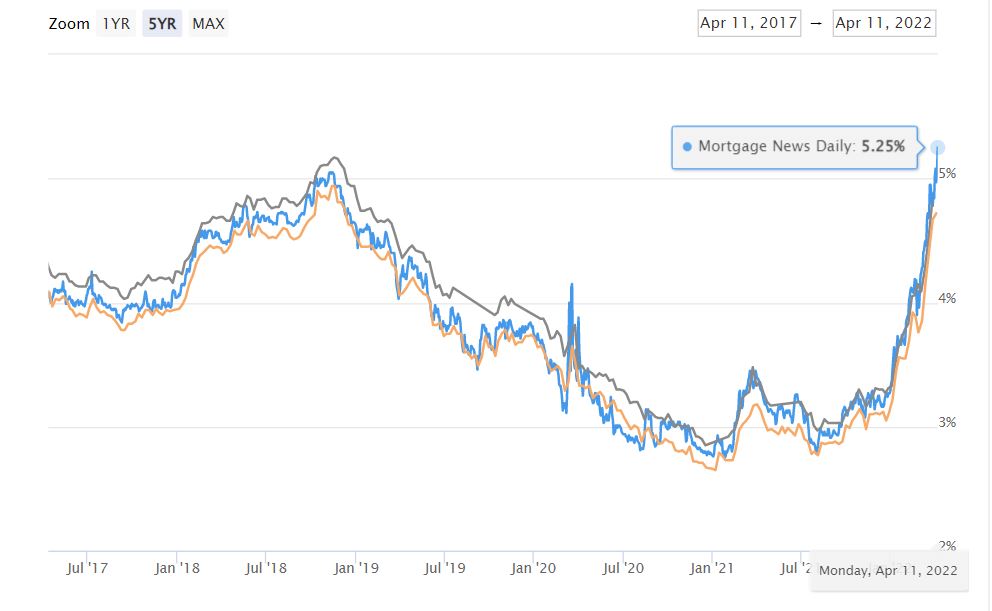
I suggested that mortgage rates should settle into the 4.75% to 5.50% range, and Bill at CR thinks the range will be 5.0% to 5.7%. Today’s rates are in the low 5s, so we have arrived and buyers should not feel the need to hurry up – but it will be bumpy over the next few months. Those with a short runway can opt for 2.375% for ten years.
Currently most forecasts are for the Fed Funds rate to rise to around 3.25%. Goldman Sach’s chief economist Jan Hatzius recently said he thinks the Fed may have to raise rates above 4%, although their baseline forecast is just about 3%.
When the Fed Funds rate peaks in this cycle, the yield curve will likely be fairly flat – meaning the 10-year treasury yield will be at about the same level as the Fed Funds rate. Based on the current estimate for the peak Fed Funds rate (3.25% to 4.0%), the 30-year fixed mortgage will likely peak at between 5.0% and 5.7%. There is some variability in the relationship, so we might see rates as high as the low 6% range. (This all depends on inflation and the Fed Funds rate – but I don’t expect rates to move much higher than the current rate – although 6% is possible).
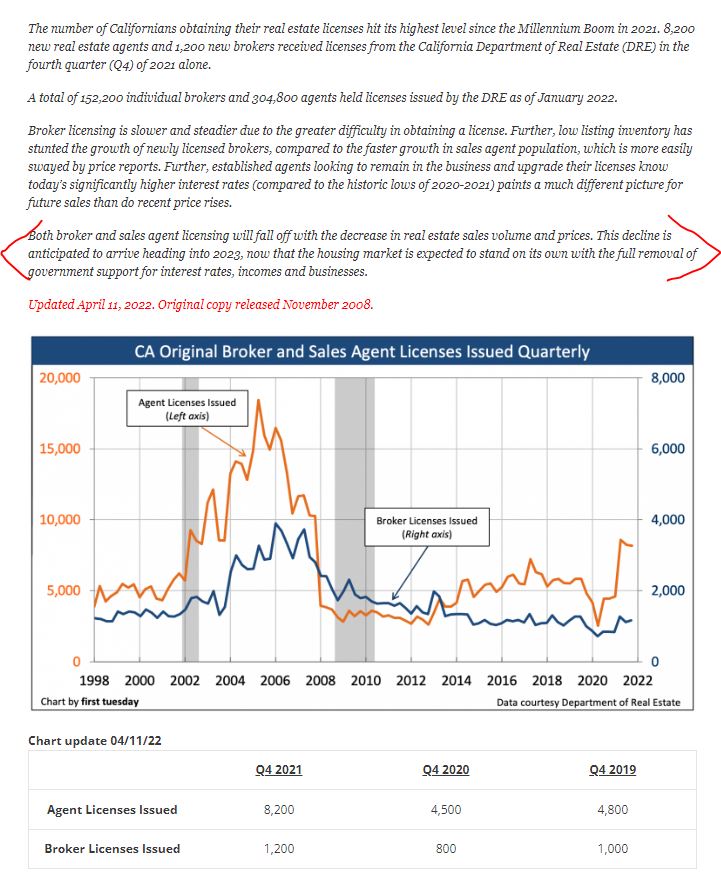
More people continue to get their real estate license.
It looks like there have been around 8,000 new licensees in each of the last 2-3 quarters! There are somewhere between 15,000 and 20,000 dues-paying realtors already in San Diego County, and last month there were 3,198 residential sales on the MLS…..for the whole county!
I think that their doomy author has been misreading the market for years, but if you are thinking about becoming a realtor, believe their nonsense and don’t bother – there is not enough business to go around.
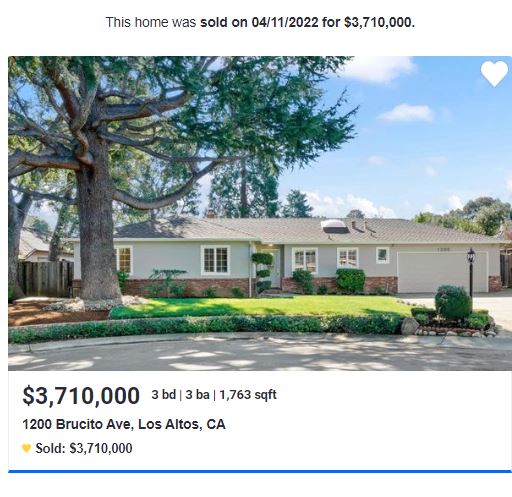
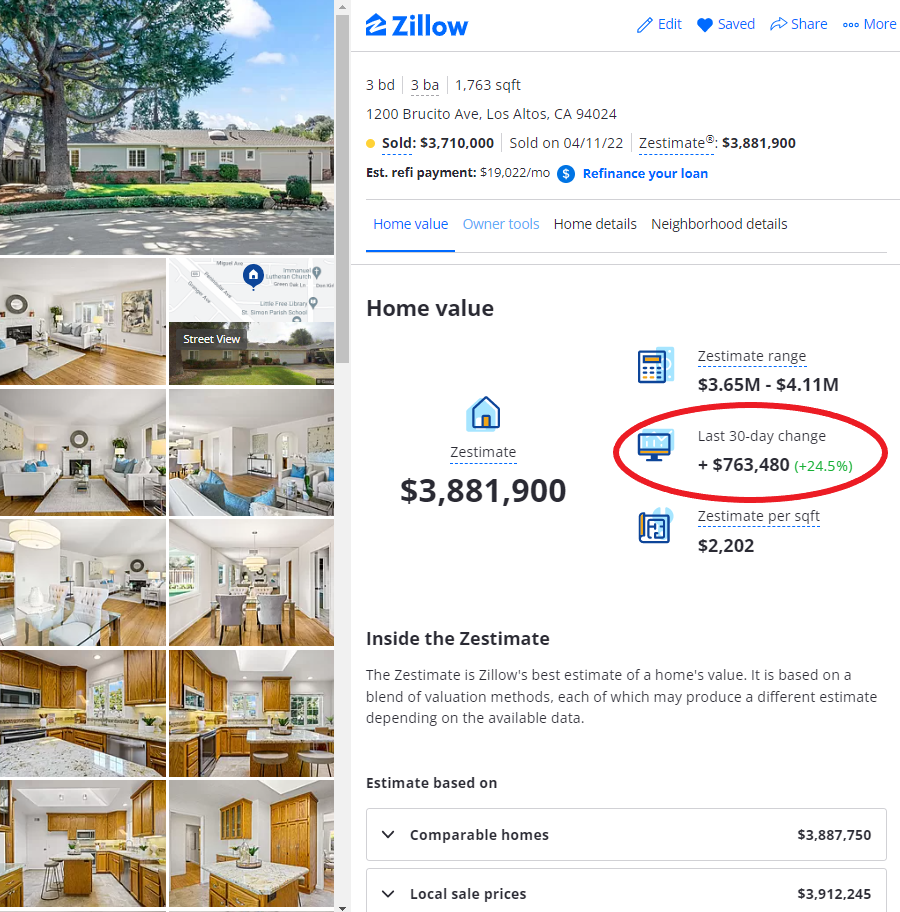
The bump over the list price is so customary in the local area that the zestimate was raised by $763,480 about the time it was marked pending – the algorithms already had the expected increase baked in!
They are enjoying The 2022 Lucky Windfall of the First Quarter, and we’ll see how well it holds up. But as long as home sales in the Bay Area keep selling for much-higher pricing than in San Diego, one of our main feeder areas will keep sending happy buyers our way!
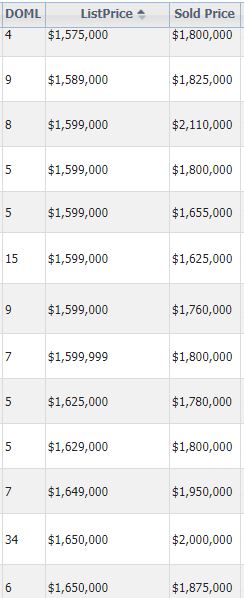
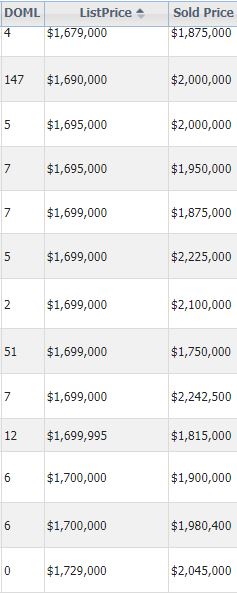
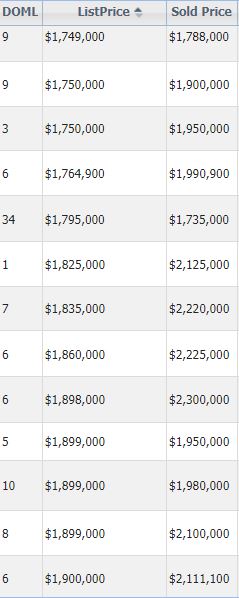
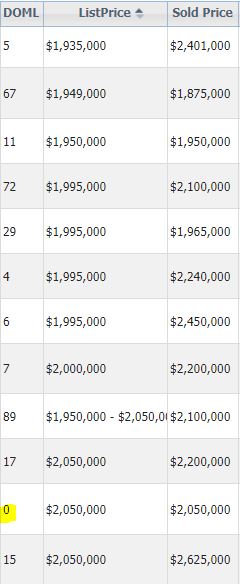
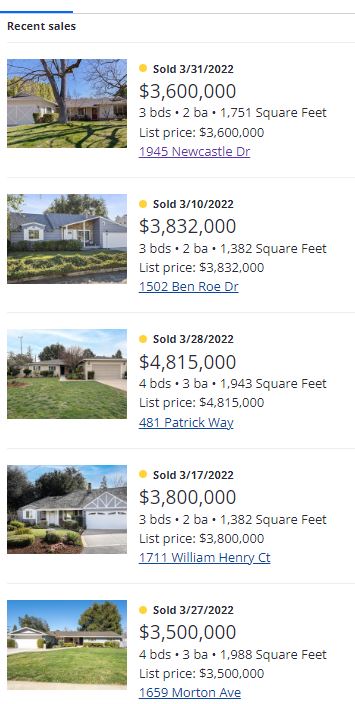
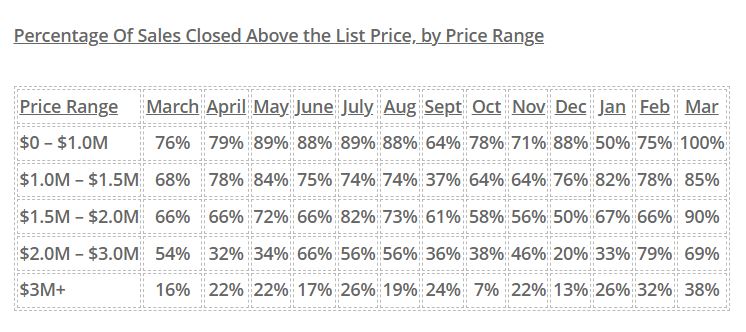
The list prices mentioned here all say that they sold for 100% of the LP, but it’s a typo – they all sold for well over. For example, Patrick Way sold for $1.1 million over, and William Henry sold for $800,000 over list:
Paying ~$2,000/sf for modest homes in Los Altos has been fairly routine lately!
Hopefully, those sellers keep coming our way. Even if their market were to dip 10% to 20% from these dizzy heights, they will still love what they can buy here for the money.
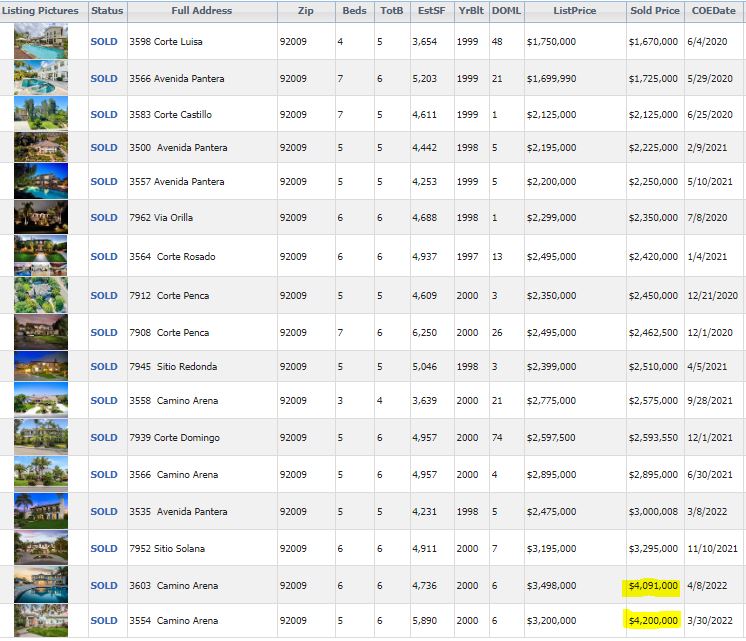
In the last 24 months, there were two sales of $1,670,000 and $1,725,000 in the Ranch of Carlsbad. In the last 12 months, there have been three sales in the $2,500,000s.
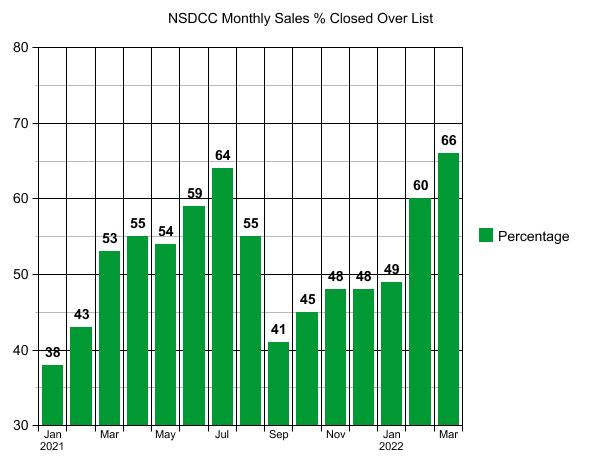
I think we can say that the statistics are starting to reflect the current environment, which is being muddled by a few factors:
There are so few listings that sellers (and listing agents) are pushing the list prices….but buyers have had enough, and the inferior properties aren’t selling like they used to.
Sellers and agents are skipping the spruce up/staging extras, and buyers are being picky.
The wait-and-see strategy is addictive, and once buyers adopt it, it’s hard to get off the fence.
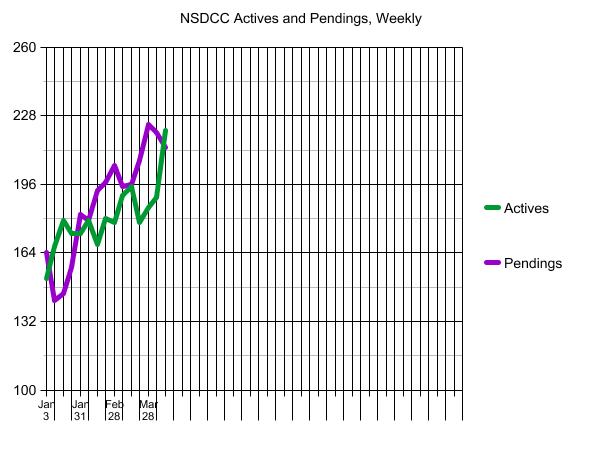
This is the first time during the selling season that there are more actives than pendings (221 vs 213). If it ever gets back to the normal 2:1 ratio, it’s going to feel like the sky is falling!
It is rare that a seller decides to sell and then lists their home for sale the same day. Usually, it’s a plan that has been in the works for months, and any last-minute adjustments – especially on price – are also rare. Don’t be surprised if the pricing over the next two months reflects the pricing of the last two months.
A fantastic spin on higher mortgage rates by two economists – an excerpt:
Mark Fleming – That’s a great question, Odeta. And when we subtract the core CPI inflation rate from the 30-year, fixed mortgage rate, we find that, with air quotes here, mortgage rates are actually negative.
Odeta Kushi – Say what now? Here we’re talking about rates as high as 5%. And now you’re telling me rates are negative?
Mark Fleming – Yep, over the last half century, there have only been two other times when core inflation was higher than the 30-year, fixed mortgage rate. Both of those were in the 1970s.
Today, we’re experiencing the extremely rare phenomenon of real, negative mortgage rates. So, while we may expect rising mortgage rates to cool the market, real estate still looks cheap, given the high inflation, not to mention the appreciation benefits that people get from the stellar asset returns that we’ve experienced recently.
Okay, thinking like a finance guy for a hot minute here. If the price of everything is rising faster than the price of borrowing at a fixed rate, aka the negative real rate of mortgages, to own an asset that’s appreciating in value. Hmmm.
Odeta Kushi – Yeah, so a significant slowdown in purchase demand due to rising mortgage rates is not necessarily a foregone conclusion, not to mention that house prices, and even sales to a lesser extent, have shown to be pretty resilient in the face of rising mortgage rates. You can refer to our podcast episode 15, if you want to know more about this.
But the SparkNotes version is in four of the last six rising mortgage rate eras, the existing-home sales increased or only declined after prolonged resistance. Home prices show even more resiliency.
Apart from the 1994 rising-rate period when house prices declined slightly and briefly, house prices have always continued to rise, albeit more slowly, when rates have increased. That’s because home sellers would rather withdraw from the market, rather than sell at lower prices, a phenomenon we refer to as ‘downside sticky.’
Of course, relative rates matter and mortgage rates have been in the 2-to-3% range during most of the pandemic. So, rising to about 4% may have a larger impact than in the earlier periods. So, it’s unclear how much rising rates will cool the purchase market. But, how would rising rates cool the housing market anyway? By reducing affordability, of course, and causing buyers to pull back from the market. In other words, by cooling demand.
JtR: Let’s note that the highly-financed buyers don’t get much of a vote because in the bidding wars over quality properties, they are sent to the back of the line. The ‘cooling demand’ from financed buyers pulling back only means fewer offers. The market’s direction will be determined by the cash buyers, and/or the big-down-payment buyers who will shrug off higher payments when they hear a catchy buzz word like ‘negative mortgage rates’. The location/condition of the home will matter more to the sales price than rates.
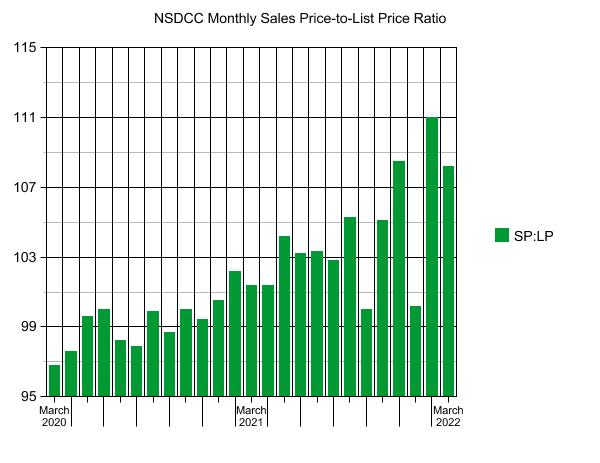
Let’s take a look at the covid history of one of our frenzy measuring sticks:
NSDCC Sales-Price-to-List-Price Ratio:
Month
# of Sales
Median List Price
Median Sales Price
SP:LP Ratio
March 2020
206
$1,492,500
$1,445,000
96.8%
Apr
156
$1,424,499
$1,390,000
97.6%
May
143
$1,399,900
$1,395,000
99.6%
Jun
274
$1,362,500
$1,363,700
100%
Jul
351
$1,450,000
$1,423,350
98.2%
Aug
350
$1,450,000
$1,419,812
97.9%
Sep
360
$1,500,000
$1,498,750
99.9%
Oct
382
$1,696,500
$1,674,100
98.7%
Nov
305
$1,599,000
$1,599,900
100%
Dec
290
$1,633,500
$1,624,391
99.4%
Jan
187
$1,716,690
$1,725,000
100.5%
Feb
224
$1,719,500
$1,758,000
102.2%
March 2021
252
$1,800,000
$1,825,000
101.4%
Apr
359
$1,799,900
$1,825,829
101.4%
May
300
$1,900,000
$1,979,500
104.2%
Jun
357
$1,900,000
$1,960,000
103.2%
Jul
312
$1,792,500
$1,852,500
103.3%
Aug
268
$1,897,000
$1,950,000
102.8%
Sep
283
$1,899,000
$2,000,000
105.3%
Oct
251
$1,899,000
$1,899,000
100%
Nov
200
$1,998,500
$2,100,000
105.1%
Dec
183
$1,995,000
$2,165,000
108.5%
Jan
140
$2,234,944
$2,240,000
100.2%
Feb
158
$2,149,500
$2,386,500
111.0%
March 2022
206
$2,425,000
$2,625,000
108.2%
The chatter increases with the lower volume, plus there are going to be months when the offerings just aren’t that tasty. But in 2022, when buyers see a home they like, they over bid substantially!
All we have to do is watch the trend over the next few months to know the direction of the market.
Trustindex verifies that the original source of the review is Google.
We sold a home with Jim and Donna and from beginning to end they were consummate professionals. Their initial walk through the property resulted in a list of items to be repaired or updated. They supplied a list of vendors and job quotes to do the repairs and updates. We originally wanted to sell ‘as is’ and just get it over with. They gave us a selling price for ‘as is’ and options for doing a few updates/repairs to doing it all with the selling price for each option. We agreed to do all they suggested and we sold for the exact price they predicted. For every dollar spent we got back more than $2 back in the selling price. And they got that price in a rising interest rate environment! Donna and Jim are extremely detailed and guide you through ever aspect of the sale. There were no surprises thanks to their guidance. We couldn’t be more pleased with their representation.
Thank you Donna and Jim,
Jerry and Mary
Heather Quejada
March 27, 2025
Trustindex verifies that the original source of the review is Google.
We have known Jim & Donna Klinge for over a dozen years, having met them in Carlsbad where our children went to the same school. As long time North County residents, it was a no- brainer for us to have the Klinges be our eyes and ears for San Diego real estate in general and North County in particular. As my military career caused our family to move all over the country and overseas to Asia, Europe and the Pacific, we trusted Jim and Donna to help keep our house in Carlsbad rented with reliable and respectful tenants for over 10 years.
Naturally, when the time came to sell our beloved Carlsbad home to pursue a rural lifestyle in retirement out of California, we could think of no better team to represent us than Jim and Donna. They immediately went to work to update our house built in 2004 to current-day standards and trends — in 2 short months they transformed it into a literal modern-day masterpiece. We trusted their judgement implicitly and followed 100% of their recommended changes. When our house finally came on the market, there was a blizzard of serious interest, we had multiple offers by the third day and it sold in just 5 days after a frenzied bidding war for 20% above our asking price! The investment we made in upgrades recommended by Jim and Donna yielded a 4-fold return, in the process setting a new high water mark for a house sold in our community.
In our view, there are no better real estate professionals in all of San Diego than Jim and Donna Klinge. Buying or selling, you must run and beg Jim and Donna Klinge to represent you! Our family will never forget Jim, Donna, and their whole team at Compass — we are forever grateful to them.
Lou F
March 27, 2025
Trustindex verifies that the original source of the review is Google.
WeI had the pleasure of working with Klinge Realty Group to sell our home in Carmel Valley, and I cannot recommend them highly enough!
Jim and Donna demonstrated exceptional professionalism, offering expert guidance on market conditions and pricing strategy, which resulted in a quick and successful sale.
Communication was prompt and we were well-informed throughout the entire process.
For anyone looking for a dedicated and knowledgeable real estate team, look no further!
---
William Sams
March 25, 2025
Trustindex verifies that the original source of the review is Google.
Donna and Jim Klinge of Klinge Realty Group have our highest possible recommendation. From Donna and Jim’s first visit to our house through closing their advice and counsel was candid and honest in all dealings. They kept us fully informed throughout the process. The house sold less than three days after listing with a two-week closing. My wife and I have sold several houses during our lives. This was by far the best experience. Klinge Reality is a premium service realtor. You can’t make a better choice for someone to sell your home fast and for top dollar.
Emily Hernandez
December 29, 2024
Trustindex verifies that the original source of the review is Google.
Donna and Jim provided exceptional support and professionalism throughout the entire process. We couldn't have been happier with their efforts. They made our house shine, and thanks to their expertise, it sold above the listing price in the very first weekend! Truly a fantastic experience from start to finish.
Jesus Adrian Sahagun
November 11, 2024
Trustindex verifies that the original source of the review is Google.
This year has been difficult on our family, mainly due to having to sell our home. Thankfully we knew God had a plan for us and working with the Klinge team was a key part of it. It was an obvious decision to work with them again after such an amazing experience when purchasing the same home we needed to sell. The challenge was, how will we do this in so little time with so much going on? Jim and Donna held our hand every step of the way. Whenever an unexpected issue arose they found and provided a solution. Never once did we feel pressured to make a decision and the Klinges were always reassuring after providing the information that the decision was ours to make. Despite the curve balls, they never panicked and exemplified the “can do” attitude, making us feel optimistic and taken care of. Their expertise and professionalism was superb. But of all the reasons to work with the Klinges, the most impactful and valuable is their compassion and genuine care for their clients. We pray that we can one day purchase our forever home and you better believe that Jim and Donna will be representing us - as long as they will have us of course. Thank you again Klinge team! Your execution, experience, and care are unmatched.
SABIHA PASHA
July 23, 2024
Trustindex verifies that the original source of the review is Google.
Jim and Donna were fantastic! Jim understanding my needs, recommending potential places, pointing out the pros and cons of each property was invaluable. Then when the offer was accepted Donna’s organized guidance through the inspections, paperwork etc made the whole process seem effortless.
So grateful that I had them on my side!
Anu Koberg
July 13, 2024
Trustindex verifies that the original source of the review is Google.
We first found Jim through his blog at bubbleinfo.com, which really showcased his knowledge of SoCal real estate. Since then we've done three transactions with Jim and Donna, and they are an incredible full service agency, with Jim's deep market insight and Donna's deft contract and project management. We trust them implicitly in their analysis and strategy, which is based on years of experience. They're always available and on top of things, and we strongly recommend them to anyone.
Bjorn Isachsen
July 10, 2024
Trustindex verifies that the original source of the review is Google.
The Good
The Klinge Realty Group operates like a finely tuned machine, with a very personal touch. We contacted them on a Sunday and they were talking to us about our family and our needs on our living room couch the following day. They carefully listened to us and worked with us to identify the best and quickest path to listing within 2 weeks to take advantage of the low inventory conditions in our South Carlsbad neighborhood. They knew our tract specifically and had many previous sales there over the years - they came prepared with a thorough analysis of comparative sales and recommended a pricing strategy that they felt confident would yield offers the first weekend on the market.
The Great
Over the next two weeks Donna coordinated a range of vendors who she knew from experience could get the preparation to list work we needed done on time and with high quality. Our light tune-up involved excellent experiences with their stagers, landscapers, contractors, electricians, and plumbers. Throughout this period Donna's daily communication was clear, concise, and responsive. Any time we had questions Donna picked up the phone or texted immediately - but almost always, she answered our questions before we even knew we had them.
The Outstanding
We had a tricky situation with a shared fence that could have delayed our escrow. Donna used superb mediation skills to negotiate the terms of replacement and was personally on site with the fence contractor to make sure everything went smoothly. The fence looks great and escrow closed on time.
The Truly Exceptional
Our house came on the market on a Wednesday and between then and Monday morning Jim was personally at all three open houses. He was in constant communication explaining potential buyer reaction and strength. As he predicted offers began to come in on Saturday and each one was incrementally higher than the last. At the end we had 5 offers, 4 of which were over list, and the final accepted offer was $100,000 over list. In addition to being over list it included rent back terms that met our needs.
The Recommendation
For all of these reasons we would strongly recommend The Klinge Team to anyone wanting to sell in North County Coastal San Diego. I had been reading Jim's bubbleinfo.com blog for 15 years and knew when the time came to sell that he would be our first call. Jim Klinge is not your standard realtor. He is keenly aware of market conditions and sales strategies. And, works his tail off - though not as hard as Donna . At this point he's gone from realtor to friend and I plan to have him over to grill and chill at our new place to talk real estate, but also just about life and raising kids in San Diego. He's more interested in relationships than his sales numbers - and that's why his sales numbers are so high. We have already recommended the Klinge's to some close friends and another successful sale is on deck right around the corner...
Chris Shea
June 21, 2024
Trustindex verifies that the original source of the review is Google.
We recently had the pleasure of working with Jim and Donna from Klinge Realty Group to sell our house, and we couldn't be more satisfied with the experience. From the initial meeting, they listened attentively to our needs and provided invaluable guidance on specific improvements to get our home market ready.
Their responsiveness throughout the entire process was truly impressive. Anytime we had questions or concerns, they were quick to address them, ensuring we felt comfortable and informed every step of the way. What stood out the most was their team and extensive network of tradespeople, which made addressing any necessary repairs or updates seamless and stress-free.
Thanks to their expertise and dedication, our house sold quickly and at a great price. We highly recommend Jim and Donna to anyone looking to buy or sell a home. They are a fantastic team who truly care about their clients and deliver exceptional results.

 ~~~~~~~~~~~~~~~~~~~~~~~~~~~~~~~~~~~~~~~~~~~~~~~